New Semester
Started
Get
50% OFF
Study Help!
--h --m --s
Claim Now
Question Answers
Textbooks
Find textbooks, questions and answers
Oops, something went wrong!
Change your search query and then try again
S
Books
FREE
Study Help
Expert Questions
Accounting
General Management
Mathematics
Finance
Organizational Behaviour
Law
Physics
Operating System
Management Leadership
Sociology
Programming
Marketing
Database
Computer Network
Economics
Textbooks Solutions
Accounting
Managerial Accounting
Management Leadership
Cost Accounting
Statistics
Business Law
Corporate Finance
Finance
Economics
Auditing
Tutors
Online Tutors
Find a Tutor
Hire a Tutor
Become a Tutor
AI Tutor
AI Study Planner
NEW
Sell Books
Search
Search
Sign In
Register
study help
mathematics
statistics
Quantitative Analysis For Management 11th Edition Barry Render, Ralph M. Stair, Michael E. Hanna - Solutions
Discuss the use of dummy variables in regression analysis.
Discuss how the coefficient of determination and the coefficient of correlation are related and how they are used in regression analysis.
Explain how the adjusted r2 value is used in developing a regression model.
Explain what information is provided by the F test.
Explain how a plot of the residuals can be used in developing a regression model.
John Smith has developed the following forecasting model:Y = 36 + 4.3X1WhereY = Demand for K10 air conditionersX1 = the outside temperature (◦F)(a) Forecast the demand for K10 when the temperature is 70°F.(b) What is the demand for a temperature of 80°F?(c) What is the demand for a temperature
The operations manager of a musical instrument distributor feels that demand for bass drums may be related to the number of television appearances by the popular rock group Green Shades during the preceding month. The manager has collected the data shown in the following table:DEMAND FOR GREEN
Using the data in Problem 4-10 test to see if there is a statistically significant relationship between sales and TV appearances at the 0.05 level of significance. Use the formulas in this chapter and Appendix D.
Using computer software, find the least squares regression line for the data in Problem 4-10. Based on the F test, is there a statistically significant relationship between the demand for drums and the number of TV appearances?
Students in a management science class have just received their grades on the first test. The instructor has provided information about the first test grades in some previous classes as well as the final average for the same students. Some of these grades have been sampled and are as follows:(a)
Using the data in Problem 4-13, test to see if there is a statistically significant relationship between the grade on the first test and the final average at the 0.05 level of significance. Use the formulas in this chapter and Appendix D.
Steve Caples, a real estate appraiser in Lake Charles, Louisiana, has developed a regression model to help appraise residential housing in the Lake Charles area. The model was developed using recently sold homes in a particular neighborhood. The price (Y) of the house is based on the square footage
Accountants at the firm Walker and Walker believed that several traveling executives submit unusually high travel vouchers when they return from business trips. The accountants took a sample of 200 vouchers submitted from the past year; they then developed the following multiple regression equation
Thirteen students entered the undergraduate business program at Rollins College 2 years ago. The following table indicates what their grade-point averages (GPAs) were after being in the program for 2 years and what each student scored on the SAT exam (maximum 2400) when he or she was in high
Bus and subway ridership in Washington, D.C., during the summer months is believed to be heavily tied to the number of tourists visiting the city. During the past 12 years, the following data have been obtained:(a) Plot these data and determine whether a linear model is reasonable.(b) Develop a
Use computer software to develop a regression model for the data in Problem 4-19. Explain what this output indicates about the usefulness of this model.
The following data give the starting salary for students who recently graduated from a local university and accepted jobs soon after graduation. The starting salary, grade-point average (GPA), and major (business or other) are provided.(a) Using a computer, develop a regression model that could be
The following data give the selling price, square footage, number of bedrooms, and age of houses that have sold in a neighborhood in the past 6 months. Develop three regression models to predict the selling price based upon each of the other factors individually. Which of these isbest?
Use the data in Problem 4-22 and develop a regression model to predict selling price based on the square footage and number of bedrooms. Use this to predict the selling price of a 2,000-square-foot house with 3 bedrooms. Compare this model with the models in Problem 4-22. Should the number of
Use the data in Problem 4-22 and develop a regression model to predict selling price based on the square footage, number of bedrooms, and age. Use this to predict the selling price of a 10-year-old, 2,000-square-foot house with 3 bedrooms.
Tim Cooper plans to invest money in a mutual fund that is tied to one of the major market indices, either the S&P 500 or the Dow Jones Industrial Average. To obtain even more diversification, Tim has thought about investing in both of these. To determine whether investing in two funds would help,
The total expenses of a hospital are related to many factors. Two of these factors are the number of beds in the hospital and the number of admissions. Data were collected on 14 hospitals, as shown in the table below:Find the best regression model to predict the total expenses of a hospital.
A sample of 20 automobiles was taken, and the miles per gallon (MPG), horsepower, and total weight were recorded. Develop a linear regression model to predict MPG, using horsepower as the only independent variable. Develop another model with weight as the independent variable. Which of these two
Use the data in Problem 4-27 to develop a multiple linear regression model. How does this compare with each of the models in Problem 4-27?
Use the data in Problem 4-27 to find the best quadratic regression model. (There is more than one to consider.) How does this compare to the models in Problems 4-27 and 4-28?
A sample of nine public universities and nine private universities was taken. The total cost for the year (including room and board) and the median SAT score (maximum total is 2400) at each school were recorded. It was felt that schools with higher median SAT scores would have a better reputation
In 2008, the total payroll for the New York Yankees was $209.1 million, while the total payroll for the Tampa Bay Rays was about $43.8 million, or about one-fifth that of the Yankees. Many people have suggested that some teams are able to buy winning seasons and championships by spending a lot of
In 2009, the New York Yankees won 103 baseball games during the regular season. The table on the next page lists the number of victories (W), the earnedrun average (ERA), and the batting average (AVG) of each team in the American League. The ERA is one measure of the effectiveness of the pitching
The closing stock price for each of two stocks was recorded over a 12-month period. The closing price for the Dow Jones Industrial Average (DJIA) was also recorded over this same time period. These values are shown in the following table:(a) Develop a regression model to predict the price of stock
In January 2008, Northern Airlines merged with Southeast Airlines to create the fourth largest U.S. carrier. The new North-South Airline inherited both an aging fleet of Boeing 727-300 aircraft and Stephen Ruth. Stephen was a tough former Secretary of the Navy who stepped in as new president and
Describe briefly the steps used to develop a forecasting system.
What is the difference between a causal model and a time-series model?
What are some of the problems and drawbacks of the moving average forecasting model?
Describe briefly the Delphi technique.
What is MAD, and why is it important in the selection and use of forecasting models?
Explain how the number of season is determined when forecasting with a seasonal component.
A seasonal index may be less than one, equal to one, or greater than one. Explain what each of these values would mean.
Explain what would happen if the smoothing constant in an exponential smoothing model was equal to zero. Explain what would happen if the smoothing constant was equal to one.
Explain when a CMA (rather than an overall average) should be used in computing a seasonal index.Explain why this is necessary.
Develop a four-month moving average forecast for Wallace Garden Supply and compute the MAD. A three-month moving average forecast was developed in the section on moving averages in Table5.3.
Using MAD, determine whether the forecast in Problem 5-13 or the forecast in the section concerning Wallace Garden Supply is more accurate.
Data collected on the yearly demand for 50-pound bags of fertilizer at Wallace Garden Supply are shown in the following table. Develop a 3-year moving average to forecast sales. Then estimate demand again with a weighted moving average in which sales in the most recent year are given a weight of 2
Develop a trend line for the demand for fertilizer in Problem 5-15, using any computer software.
In Problems 5-15 and 5-16, three different forecasts were developed for the demand for fertilizer. These three forecasts are a 3-year moving average, a weighted moving average, and a trend line. Which one would you use? Explain your answer.
Use exponential smoothing with a smoothing constant of 0.3 to forecast the demand for fertilizer given in Problem 5-15. Assume that last period's forecast for year 1 is 5,000 bags to begin the procedure.Would you prefer to use the exponential smoothing model or the weighted average model developed
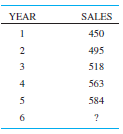
Sales of Cool-Man air conditioners have grown steadily during the past 5 years:YEAR SALES1 ...........4502 ...........4953 ...........5184 ...........5635 ...........5846 ........... ?The sales manager had predicted, before the business started, that year 1’s sales would be 410 air conditioners.
Using smoothing constants of 0.6 and 0.9 develop forecasts for the sales of Cool-Man air conditioners.Data fromSales of Cool-Man air conditioners have grown steadily during the past 5 years:
What effect did the smoothing constant have on the forecast for Cool-Man air conditioners? Which smoothing constant gives the most accurate forecast?Data from Sales of Cool-Man air conditioners have grown steadily during the past 5 years:
Use a three-year moving average forecasting model to forecast the sales of Cool-Man air conditioners.Data from Sales of Cool-Man air conditioners have grown steadily during the past 5 years:
Using the trend projection method, develop a forecasting model for the sales of Cool-Man air conditioners.Data from Sales of Cool-Man air conditioners have grown steadily during the past 5 years:
Would you use exponential smoothing with a smoothing constant of 0.3, a 3-year moving average, or a trend to predict the sales of Cool-Man air conditioners?.Data fromSales of Cool-Man air conditioners have grown steadily during the past 5 years:
Sales of industrial vacuum cleaners at R. Lowenthal Supply Co. over the past 13 months are as follows:(a) Using a moving average with three periods, determine the demand for vacuum cleaners for next February.(b) Using a weighted moving average with three periods, determine the demand for vacuum
Passenger miles flown on Northeast Airlines, a commuter firm serving the Boston hub, are as follows for the past 12 weeks:(a) Assuming an initial forecast for week 1 of 17,000 miles, use exponential smoothing to compute miles for weeks 2 through 12. Use É‘ = 0.2 (b) What is the MAD for
Emergency calls to Winter Park, Florida€™s 911 systems for the past 24 weeks are as follows:(a) Compute the exponentially smoothed forecast of calls for each week. Assume an initial forecast of 50 calls in the first week and use É‘ = 0.1. What is the forecast for the 25th
Using the 911 call data in Problem 5-27, forecast calls for weeks 2 through 25 using ɑ = 0.9. Which is best? (Again, assume that actual calls in week 25 were 85 and use an initial forecast of 50 calls.)
Consulting income at Kate Walsh Associates for the period February–July has been as follows: MONTH INCOME ($1,000S)February ......... 70.0March .......... 68.5April ............ 64.8May ........... 71.7June ........... 71.3July ........... 72.8Use exponential smoothing to
Resolve Problem 5-29 with ɑ = 0.3. Using MAD, which smoothing constant provides a better forecast?
A major source of revenue in Texas is a state sales tax on certain types of goods and services. Data are compiled and the state comptroller uses them to project future revenues for the state budget. One particular category of goods is classified as Retail Trade. Four years of quarterly data (in
Using the data in Problem 5-31, develop a multiple regression model to predict sales (both trend and seasonal components), using dummy variables to incorporate the seasonal factor into the model. Use this model to predict sales for each quarter of the next year. Comment on the accuracy of this
Trevor Harty, an avid mountain biker, always wanted to start a business selling top-of-the-line mountain bikes and other outdoor supplies. A little over 6 years ago, he and a silent partner opened a store called Hale and Harty Trail Bikes and Supplies. Growth was rapid in the first 2 years, but
The unemployment rates in the United States during a 10-year period are given in the following table. Use exponential smoothing to find the best forecast for next year. Use smoothing constants of 0.2, 0.4, 0.6, and 0.8. Which one had the lowestMAD?
Management of Davis's Department Store has used time-series extrapolation to forecast retail sales for the next four quarters. The sales estimates are $100,000, $120,000, $140,000, and $160,000 for the respective quarters before adjusting for seasonality. Seasonal indices for the four quarters have
In the past, Judy Holmes's tire dealership sold an average of 1,000 radials each year. In the past two years, 200 and 250, respectively, were sold in fall, 350 and 300 in winter, 150 and 165 in spring, and 300 and 285 in summer. With a major expansion planned, Judy projects sales next year to
The following table provides the Dow Jones Industrial Average (DJIA) opening index value on the first working day of 1991-2010: Develop a trend line and use it to predict the opening DJIA index value for years 2011, 2012, and 2013. Find the MSE for thismodel.
Refer to the DJIA data in Problem 5-37.(a) Use an exponential smoothing model with a smoothing constant of 0.4 to predict the opening DJIA index value for 2011. Find the MSE for this.(b) Use QM for Windows or Excel and find the smoothing constant that would provide the lowest MSE.
The following table gives the average monthly exchange rate between the U.S. dollar and the euro for 2009. It shows that 1 euro was equivalent to 1.324 U.S. dollars in January 2009. Develop a trend line that could be used to predict the exchange rate for 2010. Use this model to predict the
Southwestern University (SWU), a large state college in Stephenville, Texas, 30 miles southwest of the Dallas/Fort Worth metroplex, enrolls close to 20,000 students. In a typical town-gown relationship, the school is a dominant force in the small city, with more students during fall and spring than
For years The Glass Slipper restaurant has operated in a resort community near a popular ski area of New Mexico. The restaurant is busiest during the first 3 months of the year, when the ski slopes are crowded and tourists flock to the area. When James and Deena Weltee built The Glass Slipper, they
Why are - and R-charts usually used hand in hand?
Explain the difference between control charts for variables and control charts for attributes.
Explain the difference between c-charts and p-charts.
When using a control chart, what are some patterns that would indicate that the process is out of control?
What might cause a process to be out of control?
Explain why a process can be out of control even though all the samples fall within the upper and lower control limits.
Shader Storage Technologies produces refrigeration units for food producers and retail food establishments.The overall average temperature that these units maintain is 46° Fahrenheit. The average range is 2° Fahrenheit. Samples of 6 are taken to monitor the process. Determine the upper and lower
When set at the standard position, Autopitch can throw hard balls toward a batter at an average speed of 60 mph. Autopitch devices are made for both major- and minor-league teams to help them improve their batting averages. Autopitch executives take samples of 10 Autopitch devices at a time to
Zipper Products, Inc., produces granola cereal, granola bars, and other natural food products. Its natural granola cereal is sampled to ensure proper weight. Each sample contains eight boxes of cereal.The overall average for the samples is 17 ounces.The range is only 0.5 ounce. Determine the upper
Small boxes of NutraFlakes cereal are labeled "net weight 10 ounces." Each hour, random samples of size boxes are weighed to check process control.Five hours of observations yielded the following:Using these data, construct limits for - and R-Charts. Is the process in control? What other steps
Sampling four pieces of precision-cut wire (to be used in computer assembly) every hour for the past 24 hours has produced the following results:Develop appropriate control limits and determine whether there is any cause for concern in the cuttingprocess.
Due to the poor quality of various semiconductor products used in their manufacturing process, Microlaboratories has decided to develop a QC program. Because the semiconductor parts they get from suppliers are either good or defective, Milton Fisher has decided to develop control charts for
For the past two months, Suzan Shader has been concerned about machine number 5 at the West Factory. To make sure that the machine is operating correctly, samples are taken, and the average and range for each sample is computed. Each sample consists of 12 items produced from the machine. Recently,
Kitty Products caters to the growing market for cat supplies, with a full line of products, ranging from litter to toys to flea powder. One of its newer products, a tube of fluid that prevents hair balls in longhaired cats, is produced by an automated machine that is set to fill each tube with 63.5
Colonel Electric is a large company that produces lightbulbs and other electrical products. One particular lightbulb is supposed to have an average life of about 1,000 hours before it burns out. Periodically the company will test 5 of these and measure the average time before these burn out. The
For Problem 16-16, develop upper and lower control limits for the range. Do these samples indicate that the process is in control?
Kate Drew has been hand-painting wooden Christmas ornaments for several years. Recently, she has hired some friends to help her increase the volume of her business. In checking the quality of the work, she notices that some slight blemishes occasionally are apparent. A sample of 20 pieces of work
A new president at Big State University has made student satisfaction with the enrollment and registration process one of her highest priorities.Students must see an advisor, sign up for classes, obtain a parking permit, pay tuition and fees, and buy textbooks and other supplies. During one
List the assumptions that are made in Markov analysis.
What are the vector of state probabilities and the matrix of transition probabilities, and how can they be determined?
Describe how we can use Markov analysis to make future predictions.
What is an equilibrium condition? How do we know that we have an equilibrium condition, and how can we compute equilibrium conditions given the matrix of transition probabilities?
What is an absorbing state? Give several examples of absorbing states.
What is the fundamental matrix, and how is it used in determining equilibrium conditions?
Find the inverse of each of the followingmatrices:
Ray Cahnman is the proud owner of a 1955 sports car. On any given day, Ray never knows whether his car will start. Ninety percent of the time it will start if it started the previous morning, and 70% of the time it will not start if it did not start the previous morning.(a) Construct the matrix of
Alan Resnik, a friend of Ray Cahnman, bet Ray $5 that Ray's car would not start five days from now (see Problem 15-8).(a) What is the probability that it will not start five days from now if it started today? (b) What is the probability that it will not start five days from now if it did not start
Over any given month, Dress-Rite loses 10% of its customers to Fashion, Inc., and 20% of its market to Luxury Living. But Fashion, Inc., loses 5% of its market to Dress-Rite and 10% of its market to Luxury Living each month; and Luxury Living loses 5% of its market to Fashion, Inc., and 5% of its
Draw a tree diagram to illustrate what the market shares would be next month for Problem 15-10.
Goodeating Dog Chow Company produces a variety of brands of dog chow. One of their best values is the 50-pound bag of Goodeating Dog Chow. George Hamilton, president of Goodeating, uses a very old machine to load 50 pounds of Goodeating Chow automatically into each bag. Unfortunately, because the
Resolve Problem 15-12 (Goodeating Dog Chow) for five periods.
The University of South Wisconsin has had steady enrollments over the past five years. The school has its own bookstore, called University Book Store, but there are also three private bookstores in town: Bill's Book Store, College Book Store, and Battle's Book Store. The university is concerned
Showing 3200 - 3300
of 88243
First
26
27
28
29
30
31
32
33
34
35
36
37
38
39
40
Last
Step by Step Answers
.png)
.png)
.png)
.png)
.png)
.png)
.png)
.png)
.png)
.png)
.png)
.png)
.png)
.png)
.png)


.png)
.png)
.png)
.png)
.png)
.png)
.png)
.png)
.png)
.png)
.png)
.png)
.png)

