New Semester
Started
Get
50% OFF
Study Help!
--h --m --s
Claim Now
Question Answers
Textbooks
Find textbooks, questions and answers
Oops, something went wrong!
Change your search query and then try again
S
Books
FREE
Study Help
Expert Questions
Accounting
General Management
Mathematics
Finance
Organizational Behaviour
Law
Physics
Operating System
Management Leadership
Sociology
Programming
Marketing
Database
Computer Network
Economics
Textbooks Solutions
Accounting
Managerial Accounting
Management Leadership
Cost Accounting
Statistics
Business Law
Corporate Finance
Finance
Economics
Auditing
Tutors
Online Tutors
Find a Tutor
Hire a Tutor
Become a Tutor
AI Tutor
AI Study Planner
NEW
Sell Books
Search
Search
Sign In
Register
study help
mathematics
statistics
Probability & Statistics For Engineers & Scientists 7th Edition Ronald E. Walpole, Raymond H. Myers, Sharon L. Myers, Keying - Solutions
Consider the margarine fat content data in Exercise 8-25. Use the sign test to test H0: = 17.0 versus H1 = 17.0, with a = 0.05. Find the P-value for the test statistic and use this quantity to make your decision.
Consider the data in Exercise 15-2. Use the normal approximation for the sign test to test H0 = 8.5 versus H1 = 8.5, with a = 0.05. What is the P-value for this test?
Consider the data in Exercise 15-3. Use the normal approximation for the sign test to test H0 = 2.5 versus H1 < 2.5. What is the P-value for this test?
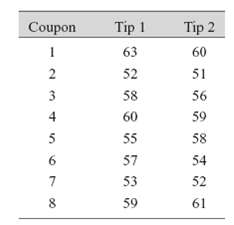
Two different types of tips can be used in a Rockwell hardness tester. Eight coupons from test ingots of a nickel based alloy are selected, and each coupon is tested twice, once with each tip. The Rockwell C-scale hardness readings are shown in the following table. Use the sign test with a = 0.05
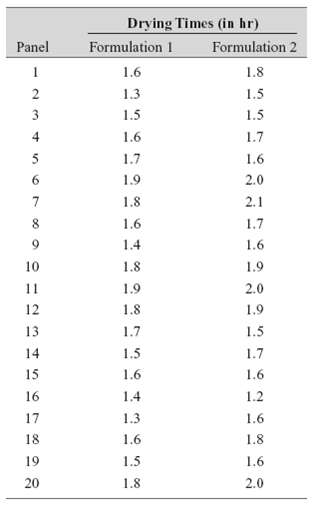
Two different formulations of primer paint can be used on aluminum panels. The drying time of these two formulations is an important consideration in the manufacturing process. Twenty panels are selected; half of each panel is painted with primer 1, and the other half is painted with primer 2. The
Use the normal approximation to the sign test for the data in Exercise 15-10. What conclusions can you draw?
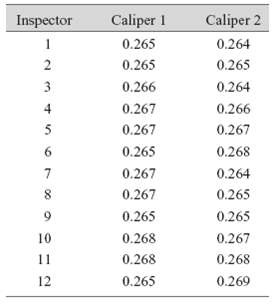
The diameter of a ball bearing was measured by 12 inspectors, each using two different kinds of calipers. The results were as follows:Is there a significant difference between the medians of the population of measurements represented by the two samples? Use a =0.05.
Consider the blood cholesterol data in Exercise 10-39. Use the sign test to determine whether there is any difference between the medians of the two groups of measurements, with a = 0.05. What practical conclusion would you draw from this study?
Use the normal approximation for the sign test for the data in Exercise 15-12. With a = 0.05, what conclusions can you draw?
Use the normal approximation to the sign test for the data in Exercise 15-13. With a = 0.05, what conclusions can you draw?
Use the normal approximation to the sign test for the data in Exercise 15-13. With a = 0.05, what conclusions can you draw? Discuss.
Suppose that we take a sample of n = 10 measurements from a normal distribution with σ1. We wish to test H0: μ = 0 against H1: μ > 0. The normal test statistic is Zo = X/ (σ/√n), and we decide to use a critical region of 1.96 (that is, reject H0 if z0 > 1.96). (a) What is
Consider the test statistic for the sign test in Exercise 15-9. Find the P-value for this statistic.
Consider the test statistic for the sign test in Exercise 15-10. Find the P-value for this statistic. Compare it to the P-value for the normal approximation test statistic computed in Exercise 15-11.
Consider the data in Exercise 15-1 and assume that the distribution of pH is symmetric and continuous. Use the Wilcox on signed-rank test with a = 0.05 to test the hypothesis H0 = μ = 7 against H1 = μ 7.
Use the normal approximation to the sign test for the data in Exercise 15-13. With a = 0.05, what conclusions can you draw? Discuss in detail.
Consider the data in Exercise 15-2. Use the large sample approximation for the Wilcox on signed-rank test to test the hypothesis H0: μ = 8.5 versus H1: μ 8.5. Use a = 0.05. Assume that the distribution of titanium content is continuous and symmetric.
Consider the data in Exercise 15-3. Use the Wilcox on signed-rank test to test the hypothesis H0: μ = 2.5 ppm versus H1: μ < 2.5 ppm with a = 0.05. Assume that the distribution of impurity level is continuous and symmetric.
Consider the Rockwell hardness test data in Exercise 15-9. Assume that both distributions are continuous and use the Wilcox on signed-rank test to test that the mean difference in hardness readings between the two tips is zero. Use a = 0.05.
Consider the paint drying time data in Exercise 15-10. Assume that both populations are continuous, and use the Wilcox on signed-rank test to test that the difference in mean drying times between the two formulations is zero. Use a = 0.01.
Apply the Wilcox on signed-rank test to the measurement data in Exercise 15-12. Use a = 0.05 and assume that the two distributions of measurements are continuous.
Apply the Wilcox on signed-rank test to the blood cholesterol data from Exercise 10-39. Use a = 0.05 and assume that the two distributions are continuous.
Apply the Wilcox on signed-rank test to the blood cholesterol data from Exercise 10-39. Use a = 0.05 and assume that the two distributions are continuous. Discuss.
One of the authors travels regularly to Seattle, Washington. He uses either Delta or Alaska. Flight delays are sometimes unavoidable, but he would be willing to give most of his business to the airline with the best on-time arrival record. The number of minutes that his flight arrived late for the
The manufacturer of a hot tub is interested in testing two different heating elements for his product. The element that produces the maximum heat gain after 15 minutes would be preferable. He obtains 10 samples of each heating unit and tests each one. The heat gain after 15 minutes (in oF) follows.
Use the normal approximation for the Wilcox on rank-sum test for the problem in Exercise 15-28. Assume that a = 0.05. Find the approximate P-value for this test statistic.
Use the normal approximation for the Wilcox on rank-sum test for the heat gain experiment in Exercise 15-30. Assume that a = 0.05. What is the approximate P-value for this test statistic?
Consider the chemical etch rate data in Exercise 10-21. Use the Wilcox on rank-sum test to investigate the claim that the mean etch rate is the same for both solutions. If a = 0.05, what are your conclusions?
Use the Wilcox on rank-sum test for the pipe deflection temperature experiment described in Exercise 10-20. If a = 0.05, what are your conclusions?
Use the normal approximation for the Wilcox on rank-sum test for the problem in Exercise 10-21. Assume that a = 0.05. Find the approximate P-value for this test.
Use the normal approximation for the Wilcox on rank-sum test for the problem in Exercise 10-20. Assume that a = 0.05. Find the approximate P-value for this test.
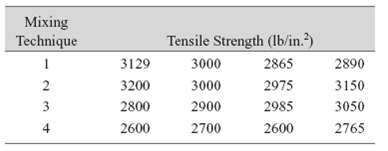
Montgomery (2001) presented the results of an experiment to compare four different mixing techniques on the tensile strength of port land cement. The results are shown in the following table. Is there any indication that mixing technique affects the strength? Use a =0.05.
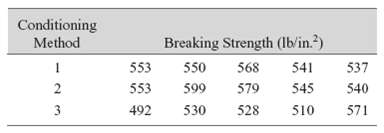
An article in the Quality Control Handbook, 3rd edition (McGraw-Hill, 1962) presents the results of an experiment performed to investigate the effect of three different conditioning methods on the breaking strength of cement briquettes. The data are shown in the following table. Using a = 0.05, is
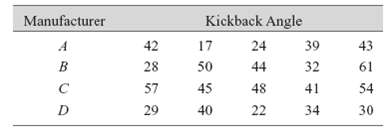
In Statistics for Research (John Wiley & Sons, 1983), S. Dowdy and S. Wear den presented the results of an experiment to measure the performance of hand-held chain saws. The experimenters measured the kickback angle through which the saw is deflected when it begins to cut a 3-inch stock
Consider the data in Exercise 13-2. Use the Kruskal-Wallis procedure with a = 0.05 to test for differences between mean uniformity at the three different gas flow rates.
The surface finish of 10 metal parts produced in a grinding process is as follows: (in micro inches): 10.32, 9.68, 9.92, 10.10, 10.20, 9.87, 10.14, 9.74, 9.80, 10.26. Do the data support the claim that the median value of surface finish is 10 micro inches? Use the sign test with a = 0.05. What is
Use the normal approximation for the sign test for the problem in Exercise 15-43. Find the P-value for this test. What are your conclusions if a = 0.05?
Fluoride emissions (in ppm) from a chemical plant are monitored routinely. The following are 15 observations based on air samples taken randomly during one month of production: 7, 3, 4, 2, 5, 6, 9, 8, 7, 3, 4, 4, 3, 2, 6. Can you claim that the median fluoride impurity level is less than 6 ppm?
Use the normal approximation for the sign test for the problem in Exercise 15-45. What is the P-value for this test?
Consider the data in Exercise 10-42. Use the sign test with a = 0.05 to determine whether there is a difference in median impurity readings between the two analytical tests.
Consider the data in Exercise 15-43. Use the Wilcox on signed-rank test for this problem with a = 0.05. What hypotheses are being tested in this problem?
Consider the data in Exercise 15-45. Use the Wilcox on signed-rank test for this problem with a = 0.05. What conclusions can you draw? Does the hypothesis you are testing now differ from the one tested originally in Exercise 15-45?
Use the Wilcox on signed-rank test with a = 0.05 for the diet-modification experiment described in Exercise 10-41. State carefully the conclusions that you can draw from this experiment.
Use the Wilcox on rank-sum test with a = 0.01 for the fuel-economy study described in Exercise 10-83. What conclusions can you draw about the difference in mean mileage performance for the two vehicles in this study?
Use the large-sample approximation for the Wilcox on rank-sum test for the fuel-economy data in Exercise 10-83. What conclusions can you draw about the difference in means if a = 0.01? Find the P-value for this test.
Use the Wilcox on rank-sum test with a = 0.025 for the fill-capability experiment described in Exercise 10-85. What conclusions can you draw about the capability of the two fillers?
Use the large-sample approximation for the Wilcox on rank-sum test with a = 0.025 for the fill-capability experiment described in Exercise 10-85. Find the P-value for this test. What conclusions can you draw?
Consider the contact resistance experiment in Exercise 13-31. Use the Kruskal-Wallis test to test for differences in mean contact resistance among the three alloys. If a = 0.01, what are your conclusions? Find the P-value for this test.
Consider the experiment described in Exercise 13-28. Use the Kruskal-Wallis test for this experiment with a = 0.05. What conclusions would you draw? Find the P-value for this test.
Consider the bread quality experiment in Exercise 13-35. Use the Kruskal-Wallis test with a = 0.01 to analyze the data from this experiment. Find the P-value for this test. What conclusions can you draw?
For the large-sample approximation to the Wilcox on signed-rank test, derive the mean and standard deviation of the test statistic used in the procedure.
Testing for Trends A turbocharger wheel is manufactured using an investment-casting process. The shaft fits into the wheel opening, and this wheel opening is a critical dimension. As wheel wax patterns are formed, the hard tool producing the wax patterns wears. This may cause growth in the
Consider the Wilcox on signed-rank test, and suppose that n = 5. Assume that H0: μ = μ0 is true. (a) How many different sequences of signed ranks are possible? Enumerate these sequences. (b) How many different values of W+ are there? Find the probability associated with each value of
The following data represent the time, in minutes, that a patient has to wait during 12 visits to a doctor's office before being seen by the doctor. Use the sign test at the 0.05 level of significance to test the doctor's claim that the median waiting time for her patients is not more than 20
The following data represent the number of hours of flight training received by 18 student pilots from a certain instructor prior to their first solo flight. Using binomial probabilities from Table A.l, perform a sign test at the 0.02 level of significance to test the Instructor??s claim that the
A food inspector examines 16 jars of a certain brand of jam to determine the percent of foreign impurities. The following data were recorded. Using the normal approximation to the binomial distribution, perform a sign test at the 0.05 level of significance to test the null hypothesis that the
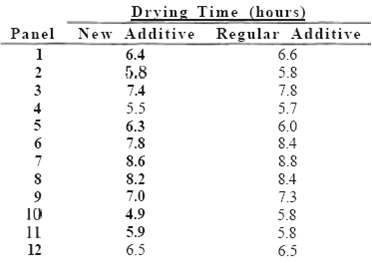
A paint supplier claims that a new additive will reduce the drying time of its acrylic paint. To test this claim, 12 panels of wood are painted, one-half of each panel with paint containing the regular additive and the other half with paint containing the new additive. The drying times, in hours,
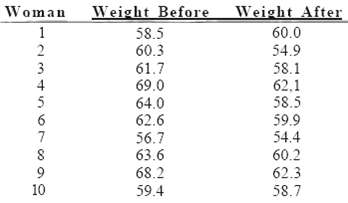
It is claimed that a new diet will reduce a person's weight by 4.5 kilograms, on average, in a period of 2 weeks. The weights of 10 women who followed this diet were recorded before and after a 2-week period yielding the following data. Use the sign test at the 0.05 level of significance to test
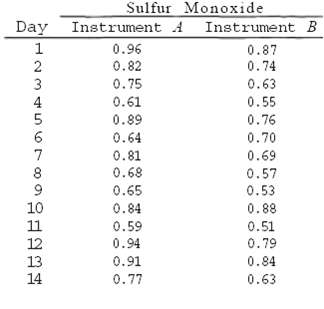
Two types of instruments for measuring the amount of sulfur monoxide in the atmosphere are being compared in an air-pollution experiment. The following readings were recorded daily for a period of 2 weeks. Using the normal approximation to the binomial distribution, perform a sign test to determine
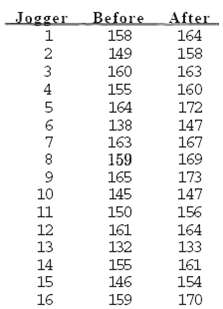
The following figures give the systolic blood pressure of 16 joggers before and after an 8 kilometer run. Use the sign test at the 0.05 level of significance to test the null hypothesis that jogging 8 kilometers increases the median systolic blood pressure by 8 points against the alternative that
Analyze the data of Exercise 16.1 by using the signed-rank test.
Analyze the data of Exercise 16.2 by using the signed-rank test.
The weights of 5 people before they stopped smoking and 5 weeks after they stopped smoking, in kilograms, are as follows. Use the signed-rank test for paired observations to test the hypothesis, at the 0.05 level of significance, that giving up smoking has no effect on a person's weight against the
Rework Exercise 16.5 by using the signed-rank test.
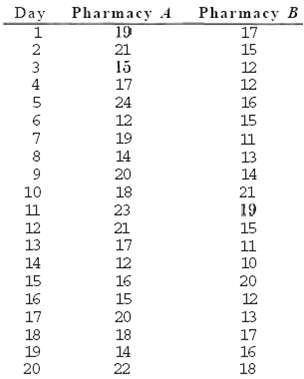
The following are the numbers of prescriptions filled by two pharmacies over a 20-day period. Use the signed-rank test at the 0.01 level of significance to determine whether the two pharmacies, "on average," fill the same number of prescriptions against the alternative that pharmacy A fills more
Rework Exercise 16.7 by using the signed-rank test,
Rework Exercise 16.6 by using the signed-ran test
A cigarette manufacturer claims that the tar content of brand B cigarettes is lower than that of brand A. To test this claim, the following determinations of tar content, in milligrams, were recorded. Use the rank-sum test with the claim is valid. 0.05 To testwhether
To find out whether a new serum will arrest leukemia, 9 patients, who have all reached an advanced stage of the disease, are selected. Five patients receive the treatment and four do not. The survival times, in years, from the time the experiment; commenced are Use the rank-sum lest, at the 0.05
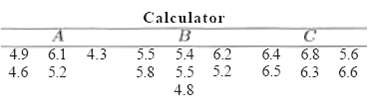
The following data represent the number of hours that two different types of scientific pocket calculators operate before a recharge: is required. Use the rank-sum test with ? = 0.01 to determine if calculator A operates longer than calculator B on a full battery charge.
A fishing line is being manufactured by two processes to determine if there is a difference in the mean breaking strength of the lines. 10 pieces by each process are selected and then tested for breaking strength. The results are as follows. Use the rank-sum test with ? = 0.1 to determine if there
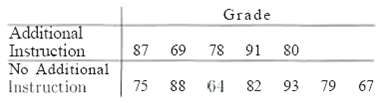
From a mathematics class of 12 equally capable students using programmed materials, 5 are selected at random and given additional instruction by the teacher. The results on the final examination were as follows. Use the rank-sum test with ? = 0.05 to determine if the additional instruction affects
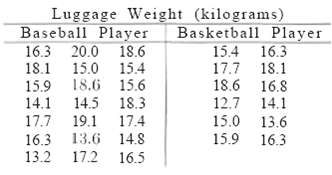
The following data represent the weights, in kilograms, of personal luggage carried on various flights by a member of a baseball team and a member of a basketball team. Use the rank-sum test with ? = 0.05 to test the null hypothesis that the two athletes carry the same amount, of luggage on the
The following data represent the operating times in hours for three types of scientific pocket calculators before a recharge is required. Use the Kruskal-Wallis test, at the 0.01 level of significance, to test the hypothesis that the operating times for all three calculators areequal.
In Exercise 13.8, use the Kruskal- Wallis test, at the 0.05 level of significance to determine if the organic chemical solvents differ significantly in sorption rate.
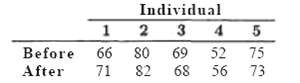
A random sample of 15 adults living in a small town is selected to estimate the proportion of voters favoring a certain candidate for mayor. Each individual was also asked if he or she was a college graduate. By letting Y and N designate the responses of "yes" and "no" to the education question,
A silver-plating process is being used to coat a certain type of serving tray. When the process is in control, the: thickness of the silver on the trays will vary randomly following a normal distribution with a mean of 0.02 millimeter and a standard deviation of 0.005 millimeter. Suppose that the
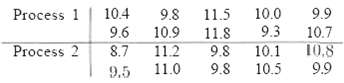
Use the runs test to test whether there is a difference in the average operating time for the two calculators of Exercise 16.17.
In an industrial production line, items are inspected periodically for defectives. The following is a sequence of defective items, D, and non defective items. N produced by this production line. Use the large-sample theory for the runs test, with a significance level of 0.05, to determine whether
Assuming that the measurements of Exercise 1.14 were recorded in successive rows from left, to right, as they were collected, use the runs test, with n = 0.05, to test the hypothesis that the data represent a random sequence.
How largo a sample is required to be 95% confident that, at least 85% of the distribution of measurements is included between the sample extremes?
What is the probability that the range of a random sample of size 24 includes at least 90% of the population?
How large a sample is required to be 99% confident that at least 80% of the population will be less than the largest observation in the sample?
What is the probability that at least 95% of a population will exceed the smallest, value in a random sample of size n = 135?
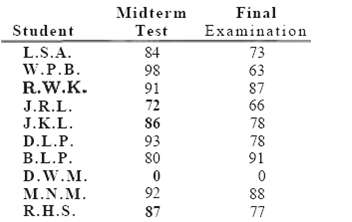
The following table gives the recorded grades for 10 students on a midterm test and the final examination in a calculus course:(a) Calculate the rank correlation coefficient.(b) Test the null hypothesis that p = 0 against the alternative that p > 0. Use a =0.025.
With reference to the data of Exercise 11.1, (a) Calculate the rank correlation coefficient; (b) Test the null hypothesis at the 0.05 level of significance that p = 0 against the alternative that p ≠ 0. Compare your results with those obtained in Exercise 11.53.
Calculate the rank correlation coefficient for the daily rainfall and amount of particulate removed in Exercise 11.9.
With reference to the weights and chest sizes of infants in Exercise 11.52(a) Calculate the rank correlation coefficient;(b) Test the hypothesis at the 0.025 level of significance that p = 0 against the alternative that p > 0.
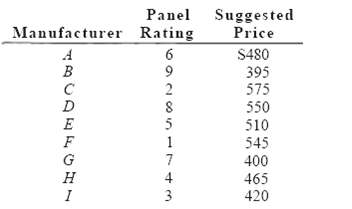
A consumer panel tests 9 brands of microwave ovens for overall quality. The ranks assigned by the panel and the suggested retail prices are as follows. Is there a significant relationship between the quality and the price of a microwave oven? Use a 0.05 level ofsignificance.
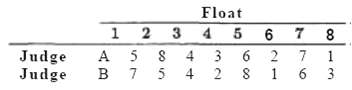
Two judges at a college homecoming parade rank 8 floats in the following order:(a) Calculate the rank correlation.(b) Test the null hypothesis that p = 0 against the alternative that p > 0. Use a =0.05.
In the article called "Risky Assumptions" by Paul Slovic, Baruch Fischoff, and Sarah Lichtenstein, published in Psychology Today (June 1980), the risk of dying in the United States from 30 activities and technologies is ranked by members of the League of Women Voters and also by experts who are
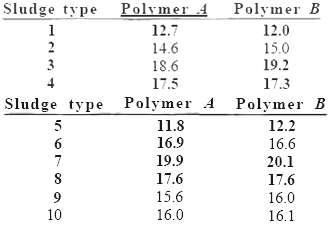
A study by a chemical company compared the drainage properties of two different polymers. Ten different sledges were used and both polymers were allowed to drain in each sledge. The free drainage was measured in ml/min.(a) Use the sign test at the 0.05 level to test the null hypothesis that polymer
In Review Exercise 13.58, use the Kruskal-Wallis test, at the 0.05 level of significance, to determine if the chemical analyses performed by the four laboratories give, on average, the same results.
Use the data from Exercise 13.12 to see if the median amount of nitrogen lost in perspiration is different for the three levels of dietary protein.
Consider X1, X2, •., X n independent Poisson random variables with parameters μ1, μ2, • • • , μ n. Use the properties of moment-generating functions to show n that the random variable Σni = 1Xi is a Poisson random variable with mean Σn i = 1 μ i and variance Σn i
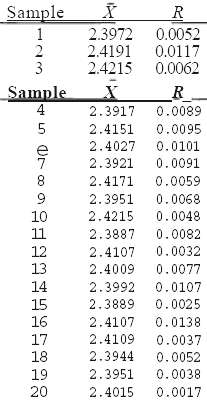
Consider the following data taken on subgroups of size 5. The data contain 20 averages and ranges on the diameter (in millimeters) of an important component part of an engine. Display X- and i?-charts. Does the process appear to be incontrol?
Suppose for Review Exercise 17.2 that the buyer has set specifications for the part. The specifications require that the diameter fall in the range covered by 2.40000 ± 0.0100 mm. What proportion of units produced by this process will not conform to specifications?
For the situation of Review Exercise 17.2, give numerical estimates of the mean and standard deviation of the diameter for the part being manufactured in the process.
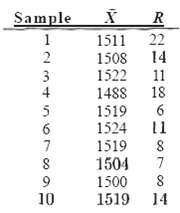
Consider the data of Table 17.1. Suppose that additional samples of size 5 are taken and tensile strength recorded. The sampling produces the following results (in pounds per square inch).(a) Plot the data, using the X- and R - charts for the preliminary data of Table 17.1.(b) Docs the process
Consider an in-control process with mean p = 25 and er = 1.0. Suppose that subgroups of size 5 are used with control limits, μ + 3σ/√n, and centerline at p. Suppose that a shift occurs in the mean, and thus the new mean is p = 26.5.(a) What is the average number of samples required (following
Showing 2600 - 2700
of 88243
First
20
21
22
23
24
25
26
27
28
29
30
31
32
33
34
Last
Step by Step Answers