New Semester
Started
Get
50% OFF
Study Help!
--h --m --s
Claim Now
Question Answers
Textbooks
Find textbooks, questions and answers
Oops, something went wrong!
Change your search query and then try again
S
Books
FREE
Study Help
Expert Questions
Accounting
General Management
Mathematics
Finance
Organizational Behaviour
Law
Physics
Operating System
Management Leadership
Sociology
Programming
Marketing
Database
Computer Network
Economics
Textbooks Solutions
Accounting
Managerial Accounting
Management Leadership
Cost Accounting
Statistics
Business Law
Corporate Finance
Finance
Economics
Auditing
Tutors
Online Tutors
Find a Tutor
Hire a Tutor
Become a Tutor
AI Tutor
AI Study Planner
NEW
Sell Books
Search
Search
Sign In
Register
study help
mathematics
statistics
Basic Statistics for the Behavioral Sciences 6th edition Gary W. Heiman - Solutions
Complete the chart below to identify the characteristics of each variable.
What is the difference between an experiment and a correlational study?
What do each of the following symbols mean?(a) N;(b) f,(c) rel. f;(d) cf.
What is the difference between how we use the proportion of the total area under the normal curve to determine relative frequency and how we use it to determine percentile.
(a) How is percentile defined in a small sample? (b) How is percentile defined for a large sample or population when calculated using the normal curve?
In reading psychological research, you encounter the following statements. Interpret each one. (a) “The IQ scores were approximately normally distributed.” (b) “A bimodal distribution of physical agility scores was observed.” (c) “The distribution of the patients’ memory scores was
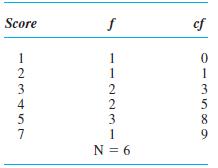
From the data 1,4, 5, 3, 2, 5, 7, 3, 4, and 5, Poindexter created the following frequency table. What five things did he do wrong?
(a) On a normal distribution of exam scores, Poindexter scored at the 10th percentile, so he claims that he outperformed 90% of his class. Why is he correct or incorrect? (b) Because Foofy’s score is in a tail of the distribution, she claims she had one of the highest scores on the exam. Why is
Interpret each of the following.(a) In a small sample, you scored at the 35th percentile.(b) Your score has a rel. f of .40.(c) Your score is in the upper tail of the normal curve.(d) Your score is in the left-hand tail of the normal curve.(e) Your score has a cf of 50.(f) From the normal curve,
Draw a normal curve and identify the approximate location of the following scores. (a) You have the most frequent score. (b) You have a low-frequency score, but the score is higher than most. (c) You have one of the lower scores, but it has a relatively high frequency. (d) Your score seldom
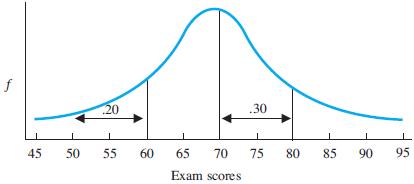
The following shows the distribution of final exam scores in a large introductory psychology class. The proportion of the total area under the curve is given for two segments.(a) Order the scores 45, 60, 70, 72, and 85 from most frequent to least frequent.(b) What is the percentile of a score of
(a) What is the difference between a bar graph and a histogram? (b) With what kind of data is each used?
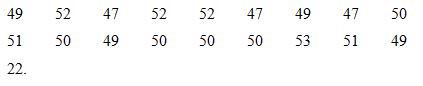
Organize the ratio scores below in a table showing simple frequency, relative frequency, and cumulative frequency.
(a) Draw a simple frequency polygon using the data in question 23.(b) Draw a relative frequency histogram of these data.In Question 23
Organize the interval scores below in a table showing simple frequency, cumulative frequency, and relative frequency.
Using the data in question 25, draw the appropriate graph to show (a) Simple frequency and (b) Relative frequency.
Describe each scale of measurement.
(a) Which scales of measurement are assumed to be discrete; what does this mean? (b) Which scales are assumed to be continuous; what does this mean?
What type of graph should you create when counting the frequency of: (a) The brands of cell phones owned by students? Why? (b) The different body weights reported in a statewide survey? Why? (c) The people falling into one of eight salary ranges? Why? (d) The number of students who were absent from
An experimenter studies vision in low light by having participants sit in a darkened room for either 5, 15, or 25 minutes and then tests their ability to correctly identify 20 objects. (a) What is the independent variable here? (b) What are the conditions? (c) What is the dependent variable?
Our N is 50, and for some scores we have selected the proportion of the area under the curve is .60. (a) What percent of the time do we expect these scores to occur? (b) How many of our participants do we expect to have these scores?
(a) What is the difference between a histogram and a polygon? (b) With what kind of data is each used?
(a) What is the difference between a score’s simple frequency and its relative frequency? (b) What is the difference between a score’s cumulative frequency and its percentile?
(a) What is the advantage of computing relative frequency instead of simple frequency? (b) What is the advantage of computing percentile instead of cumulative frequency?
(a) What is the difference between a skewed distribution and a normal distribution? (b) What is the difference between a bimodal distribution and a normal distribution? (c) What does a rectangular distribution indicate about the frequencies of the scores?
(a) Why must the cf for the highest score in a sample equal N? (b) Why must the sum of all f s in a sample equal N?
What is the difference between graphing a relationship as we did in Chapter 2 and graphing a frequency distribution?
(a) What is the symbol for a score’s deviation from the mean?(b) What is the symbol for the sum of the deviations?(c) What does it mean to say “the sum of the deviations around the mean equals zero”?
Present an example where data mining is crucial to the success of a business. What data mining functions does this business need? Can they be performed alternatively by data query processing or simple statistical analysis?
For the following data, compute(a) The mean and(b) The mode.
(a) In question 13, what is your best estimate of the median (without computing it)? (b) Explain why you think your answer is correct. (c) Calculate the approximate median using the method described in this chapter.
A researcher collected the following sets of data. For each, indicate the measure of central tendency she should compute:(a) The following IQ scores: 60, 72, 63, 83, 68, 74, 90, 86, 74, and 80;(b) The following error scores: 10,15, 18,15, 14, 13,42, 15, 12,14, and 42;(c) The following blood types:
You misplaced two of the scores in a sample, but you have the data indicated be-low. What should you guess the missing scores to be? Why?
On a normal distribution of scores, four participants obtained the following deviation scores: —5, 0, +3, and +1. (a) Which person obtained the lowest raw score? How do you know? (b) Which person’s raw score had the lowest frequency? How do you know? (c) Which person’s raw score had the
In a normal distribution of scores, five participants obtained the following deviation scores: +1, —2, +5, and —10. (a) Which score reflects the highest raw score? (b) Which score reflects the lowest raw score? (c) Rank-order the deviation scores in terms of their frequency, starting with the
(a) In question 19, give a title to the graph, using “as a function of.”(b) If you participated in the study in question 19 and had been deprived of 5 hours of sleep, how many errors do you think you would make?(c) If we tested all people in the world after 5 hours of sleep deprivation, how
You hear that a line graph of data from the Grumpy Emotionality Test slants downward as a function of increases in the amount of sunlight present on the day participants were tested. (a) What does this tell you about the mean scores for the conditions? (b) What does this tell you about the raw
You conduct a study to determine the impact that varying the amount of noise in an office has on worker productivity. You obtain the following productivity scores.(a) Assuming that productivity scores are normally distributed ratio scores, compute the summaries of this experiment. (b) Draw the
Assume that the data in question 25 reflect a highly skewed interval variable. (a) Compute the summaries of these scores. (b) What conclusion would you draw from the sample data? (c) What conclusion would you draw about the populations produced by this experiment?
(a) How do you recognize the independent variable of an experiment? (b) How do you recognize the dependent variable?
(a) What is the rule for when to make a bar graph in any type of study? (b) Variables using what scales meet this rule? (c) How do you recognize such scales? (d) What is the rule for when to connect data points with lines? (e) Variables using what scales meet this rule? (f) How do you recognize
When graphing the results of an experiment: (a) Which variable is plotted on the X axis? (b) Which variable is plotted on the Y axis. (c) When do you produce a bar graph or a line graph?
Foofy conducts an experiment in which participants are given 1, 2, 3, 4, 5, or 6 hours of training on a new computer statistics program. They are then tested on the speed with which they can complete several analyses. She summarizes her results by computing that the mean number of training hours
For each of the experiments below, determine (1) which variable should be plotted on the Y axis and which on the X axis, (2) whether the researcher should use a line graph or a bar graph to present the data, and (3) how she should summarize scores on the dependent variable: (a) a study of income as
In a condition of an experiment, a researcher obtains the following creativity scores: 3210748664 In terms of creativity, interpret the variability of these data using the following: (a) The range, (b) The variance, and (c) The standard deviation.
If you could test the entire population in question 11, what would you expect each of the following to be?(a) The typical, most common creativity score;(b) The variance;(c) The standard deviation;(d) The two scores between which about 68% of all creativity scores occur in this situation.
In Question 11:(a) What are the scores at — 1SX and + 1SX from the mean?(b) If N is 1000, how many people do you expect will score between 1.59 and 6.61?(c) How many people do you expect will score below 1.59?
As part of studying the relationship between mental and physical health, you obtain the following heart rates:In terms of differences in heart rates, interpret these data using the following:(a) The range,(b) The variance, and(c) The standard deviation.
If you could test the population in question 14, what would you expect each of the following to be?(a) The shape of the distribution;(b) The typical, most common rate;(c) The variance;(d) The Standard deviation;(e) The two scores between which about 68% of all heart rates fall.
Foofy has a normal distribution of scores ranging from 2 to 9.(a) She computed the variance to be - .06. What should you conclude about this answer, and why?(b) She recomputes the standard deviation to be 18. What should you conclude, and why?(c) She recomputes the variance to be 1.36. What should
From his statistics grades, Guchi has aX of 60 and SX = 20. Pluto has aX of 60 and SX = 5. (a) Who is the more inconsistent student, and why? (b) Who is more accurately described as a 60 student, and why? (c) For which student can you more accurately predict the next test score, and why? (d) Who is
Indicate whether by knowing someone’s score on the first variable, the relationship accounts for a large or small amount of the variance in the second variable. (a) For children ages 1 to 6, using age to predict height; (b) For ages 30 to 40, using age to predict the driving ability of
Consider the results of this experiment:(a) What €œmeasures€ should you compute to summarize the experiment? (b) These are ratio scores. Compute the appropriate descriptive statistics and summarize the relationship in the sample data. (c) How consistent does it appear the
What do measures of variability communicate about (a) The size of differences among the scores in a distribution? (b) How consistently the participants behaved? (c) The size of our “average error” when we predict that participants obtained the mean?
Say that you conducted the experiment in question 19 on the entire population.(a) Summarize the relationship that you’d expect to observe.(b) How consistently do you expect participants to behave in each condition?
In two studies, the mean is 40 but in Study A, SX = 5, and in Study B, SX = 10. (a) What is the difference in the appearance of the distributions from these studies? (b) Where do you expect the majority of scores to fall in each study?
Consider these ratio scores from an experiment:(a) What should you do to summarize the experiment? (b) Summarize the relationship in the sample data. (c) How consistent were participants in each condition?
Say that you conducted the experiment in question 22 on the entire population. (a) Summarize the relationship that you’d expect to observe. (b) How consistently do you expect participants to behave in each condition?
What is a researcher communicating with each of the following statements?(a) “The line graph of the means was relatively flat, although the variability in each condition was quite large.”(b) “For the sample of men (and ) we conclude . . . ”(c) “We expect that in the population the average
For each of the following, identify the conditions of the independent variable, the dependent variable, their scales of measurement, which measure of central tendency and variability to compute and which scores you would use in the computations. (a) We test whether participants laugh longer (in
For each experiment in question 28, indicate the type of graph you would create, and how you would label the X and Y axes. In Question 28 (a) We test whether participants laugh longer (in seconds) to jokes told on a sunny or rainy day. (b) We test babies whose mothers were or were not recently
(a) What is the range? (b) Why is it not the most accurate measure of variability? (c) When is it used as the sole measure of variability?
(a) What do both the variance and the standard deviation tell you about a distribution? (b) Which measure will you usually want to compute? Why?
(a) What is the mathematical definition of the variance? (b) Mathematically, how is a sample’s variance related to its standard deviation and vice versa?
(a) What do SX, SX, and aX have in common in terms of what they communicate?(b) How do they differ in terms of their use?
(a) How do we determine the scores that mark the middle 68% of a sample?(b) How do we determine the scores that mark the middle 68% of a known population?(c) How do we estimate the scores that mark the middle 68% of an unknown population?
(a) What does a z-score indicate? (b) Why are z-scores important?
In an English class last semester, Foofy earned a 76 (X = 85, SX = 10). Her friend, Bubbles, in a different class, earned a 60 (X = 50, SX = 4). Should Foofy be bragging about how much better she did? Why?
Poindexter received a 55 on a biology test (X = 50) and a 45 on a philosophy test (X = 50). He is considering whether to ask his two professors to curve the grades using z-scores. (a) Does he want the SX to be large or small in biology? Why? (b) Does he want the SX to be large or small in
Foofy computes z-scores for a set of normally distributed exam scores. She obtains a z-score of -3.96 for 8 out of 20 of the students. What do you conclude?
For the data,(a) Compute the z-score for the raw score of 10. (b) Compute the z-score for the raw score of 6.
For the data in question 13, find the raw scores that correspond to the following: (a) z = +1.22; (b) z = -0.48.
Which z-score in each of the following pairs corresponds to the lower raw score? (a) z = +1.0 or z = +2.3; (b) z = -2.8 or z = -1.7; (c) z = - .70 or z = - .20; (d) z = 0.0 or z = -2.0.
For each pair in question 15, which z-score has the higher frequency? In Question 15 (a) z = +1.0 or z = +2.3; (b) z = -2.8 or z = -1.7; (c) z = - .70 or z = - .20; (d) z = 0.0 or z = -2.0.
In a normal distribution, what proportion of all scores would fall into each of the following areas? (a) Between the mean and z = +1.89; (b) Below z = -2.30; (c) Between z = -1.25 and z = +2.75; (d) Above z = +1.96 and below -1.96.
For a distribution in which X = 100, SX = 16, and N = 500:(a) What is the relative frequency of scores between 76 and the mean?(b) How many participants are expected to score between 76 and the mean?(c) What is the percentile of someone scoring 76?(d) How many subjects are expected to score above
Poindexter may be classified as having a math dysfunction—and not have to take statistics—if he scores below the 25th percentile on a diagnostic test. The ^ of the test is 75 (aX = 10). Approximately what raw score is the cutoff score for him to avoid taking statistics?
For an IQ test, we know the population ^ = 100 and the aX = 16. We are interested in creating the sampling distribution when N = 64.(a) What does that sampling distribution of means show?(b) What is the shape of the distribution of IQ means and the mean of the distribution?(c) Calculate Cj for this
Someone has two job offers and must decide which to accept. The job in City A pays $47,000 and the average cost of living there is $65,000, with a standard deviation of $15,000. The job in City B pays $70,000, but the average cost of living there is $85,000, with a standard deviation of $20,000.
Suppose you own shares of a company’s stock, the price of which has risen so that, over the past ten trading days, its mean selling price is $14.89. Over the years, the mean price of the stock has been $10.43 (CX = $5.60.) You wonder if the mean selling price over the next ten days can be
A researcher develops a test for selecting intellectually gifted children, with a ^ of 56 and a CX of 8.(a) What percentage of children are expected to score below 60?(b) What percentage of scores will be above 54?(c) A gifted child is defined as being in the top 20%. What is the minimum test score
Using the test in question 23, you measure 64 children, obtaining a X of 57.28. Slug says that because this X is so close to the ^ of 56, this sample could hardly be considered gifted.(a) Perform the appropriate statistical procedure to determine whether he is correct.(b) In what percentage of the
A researcher reports that a sample mean produced a relatively large positive or negative z score. (a) What does this indicate about that mean’s relative frequency? (b) What graph did the researcher examine to make this conclusion? (c) To what was the researcher comparing his mean?
(a) What does a relatively small standard deviation indicate about the scores in a sample?(b) What does this indicate about how accurately the mean summarizes the scores.(c) What will this do to the z-score for someone who is relatively far from the mean? Why?
(a) With what type of data is it appropriate to compute the mean and standard deviation? (b) With what type of data is it appropriate to compute z-scores?
(a) What is the difference between a proportion and a percent? (b) What are the mathematical steps for finding a specified percent of N?
(a) We find that .40 of a sample of 500 people score above 60. How many people scored above 60? (b) In statistical terms, what are we asking about a score when we ask how many people obtained the score? (c) We find that 35 people out of 50 failed an exam. What proportion of the class failed? (d)
What is the difference between the normal distributions we’ve seen in previous chapters and (a) a z-distribution and (b) a sampling distribution of means?
(a) What is the standard normal curve? (b) How is it applied to a set of data? (c) What three criteria should be met for it to give an accurate description of the scores in a sample?
(a) What is a sampling distribution of means?(b) When is it used?(c) Why is it useful?
(a) What three things does the central limit theorem tell us about the sampling distribution of means? (b) Why is the central limit theorem so useful?
(a) What are the steps for using the standard normal curve to find a raw score’s relative frequency or percentile? (b) What are the steps for finding the raw score that cuts off a specified relative frequency or percentile? (c) What are the steps for finding a sample mean’s relative frequency?
What is the difference between an experiment and a correlational study in terms of how the researcher (a) Collects the data? (b) Examines the relationship?
(a) What is the restriction of range problem?(b) What produces a restricted range?(c) How is it avoided?
(a) What does a researcher mean when he states that a particular variable is a “a good predictor?”(b) What does a researcher mean when she says an X variable accounts for little of the variance in Y?
For each of the following, indicate whether it is a positive linear, negative linear, or nonlinear relationship: (a) Quality of performance (Y) increases with increased arousal (X) up to an optimal level; then quality of performance decreases with increased arousal. (b) Overweight people (X) are
Poindexter sees the data in question 12d and concludes, “We should stop people from moving into bear country so that we can preserve our bear population.” What is the problem with Poindexter’s conclusion?
For each of the following, give the symbol for the correlation coefficient you should compute. You measure(a) SAT scores and IQ scores;(b) Taste rankings of tea by experts and those by novices;(c) Finishing position in a race and amount of liquid consumed during the race.
Poindexter finds that r = —.40 between the variables of number of hours studied (X) and number of errors on a statistics test (Y). He also finds that r = + .36 between the variables of time spent taking the statistics test and the number of errors on the test. He concludes that the time spent
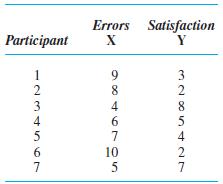
A researcher measures the following scores for a group of people. The X variable is the number of errors on a math test, and the Y variable is the person’s level of satisfaction with his/her performance.(a) With such ratio scores, what should the researcher conclude about this relationship?(b)
Showing 36900 - 37000
of 88243
First
363
364
365
366
367
368
369
370
371
372
373
374
375
376
377
Last
Step by Step Answers
.png)
.png)
.png)
.png)
.png)
.png)
.png)