New Semester
Started
Get
50% OFF
Study Help!
--h --m --s
Claim Now
Question Answers
Textbooks
Find textbooks, questions and answers
Oops, something went wrong!
Change your search query and then try again
S
Books
FREE
Study Help
Expert Questions
Accounting
General Management
Mathematics
Finance
Organizational Behaviour
Law
Physics
Operating System
Management Leadership
Sociology
Programming
Marketing
Database
Computer Network
Economics
Textbooks Solutions
Accounting
Managerial Accounting
Management Leadership
Cost Accounting
Statistics
Business Law
Corporate Finance
Finance
Economics
Auditing
Tutors
Online Tutors
Find a Tutor
Hire a Tutor
Become a Tutor
AI Tutor
AI Study Planner
NEW
Sell Books
Search
Search
Sign In
Register
study help
mathematics
statistics
Elementary Statisitcs 2nd edition Barry Monk - Solutions
Explain why the General Addition Rule P( A or B) = P( A) + P( B) - P( A and B) may be used even when A and B are mutually exclusive events.
Sometimes events are in the form ‘‘at least’’ a given number. For example, if a coin is tossed five times, an event could be getting at least two heads. What would be the complement of the event of getting at least two heads?
Use the result from Exercise 1 along with the result P( Alive at age 10) = 0.99123 to compute P
Use the result from Exercise 2 along with the appropriate number from the table to compute P
Use the result from Exercise 3 along with the appropriate number from the table to compute P.
Compute the probability that a person is alive at ages 50, 60, 70, 80, 90, and 100.
Find the probability that a person aged 20 is still alive at age 100.
Find the probability that a person aged 50 is still alive at age 70.
Which is more probable, that a person aged 20 is still alive at age 50, or that a person aged 50 is still alive at age 60?
A life insurance company sells term insurance polices. These policies pay $ 100,000 if the policyholder dies before age 70, but pay nothing if a person is still alive at age 70. If a person buys a policy at age 40, what is the probability that the insurance company does not have to pay?
Which are distributions? Which of the following tables represent probhility distributions?
Suspensions: The concentration of particles in a suspension is 2 per milliliter. A volume of 3 milliliters is withdrawn. Find the following probabilities.a. P(Exactly five particles are withdrawn)b. P(Fewer than two particles are withdrawn)c. P(More than one partide is withdrawn)
Standard deviation: Refer to Exercise 12. Find the standard deviation of the number of particles that are withdrawn.
Congenital disease: The connexin-26 mutation is a genetic mutation that results in deafness. The probability that a person carries a gene with this mutation is 0.0151. Find the probability that exactly 10 people in a sample of 500 carry this mutation.
Mean variance and standard deviation: A random variable X has the following probability distributionsa. Find the mean of X.b. Find the variance of X.c. Find the standard deviation of X.
AP tests: Advanced Placement (AP) tests are graded on a scale of 1 (low) through 5 (high). The College Board reported that the distribution of scores on the AP Statistics Exam in 2009 was as follows:A score of 3 or higher is generally required for college credit. What is the probability that a
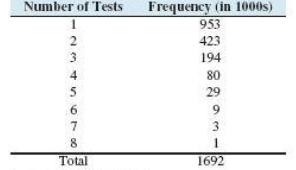
AP tests again: During the 2008-2009 academic year. approximately 1.7 million students took one or more AP tests. Following is the frequency distribution of the number of AP tests taken by students who took one or more AP tests.Let X represent the number of exams taken by a student who took one or
a. What is the probability that three or fewer of the winners will be women?b. What is the probability that three of the winners will be of one gender and two of the winners will be of the other gender?
Genetic disease: Sickle-cell anemia is a disease that results when a person has two copies of a certain recessive gene. People with one copy of the gene are called carriers. Carriers do not have the disease, but can pass the gene on to their children. A child born to parents who are both carriers
Craps: In the game of craps, you may bet $1 that the next roll of the dice will be an 11. If the dice come up 11, your profit is $15. If the dice don't come up 11, you lose $1. The probability that the dice come up 11 is 1/18. What is the expected value of your profit? Is it an expected gain or an
Looking for a job: According to the General Social Survey conducted at the University of Chicago, 59% of employed adults believe that if they lost their job, it would be easy to find another one with a similar salary. Suppose that 10 employed adults are randomly selected.a. Find the probability
Reading tests: According to the National Center for Education Statistics, 66% of fourth-graders could read at a basic level in 2007. Suppose that eight fourth-graders are randomly selected.a. Find the probability that exactly five of them can mad at a basic level.b. Find the probability that more
If a business decision has an expected gain, is it possible to lose money? Explain.
Twenty percent of the men in a certain community are more than 6 feet tall. An anthropologist samples five men from a large family in the community and counts the number X who are more than 6 feet tall. Explain why the binomial distribution is not appropriate in this situation. Is P(X = 0) likely
The surprising nature of Benford's law makes it a useful tool to detect fraud. When people make up numbers, they tend to make the first digits approximately uniformly distributed; in other words, they have approximately equal numbers of Is, 2.s. and so on. Many tax agencies, including the Internal
Find the area: Find the area under the standard normal curvea. To the left of z .= 035b. To the right of z = —1.56c. Between z= 0.35 and z = 2.47
Facebook: Eighty percent of the students at a particular large university have logged on to Facebook at least once in the past week. A sample of 95 students is asked about their Internet habits.a. What is the probability that less than 75% of the sampled students have logged on to Facebook within
ICs all politics: A politician in a close election race claims that 52% of the voters support him. A poll is taken in which 200 voters are sampled, and 44% of them support the politician.a. If the claim is true, what is the probability of obtaining a sample proportion that is less than or equal to
Side effects: A new medical procedure produces side effects in 25% of the patients who receive it. In a clinical trial. 60 people undergo the procedure. What is the probability that 20 or fewer experience side effects?
Defective rods: A grinding machine used to manufacture steel rods produces rods, 5% of which are defective. When a customer orders 1000 rods, a package of 1060 rods is shipped. with a guarantee that at least 1000 of the rods are good. What is the probability that a pad-cage of 1060 rods contains
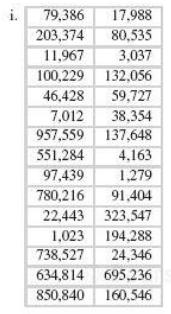
Is it normal? Is it reasonable to treat the following sample as though it comes from an approximately normal population? Explain.
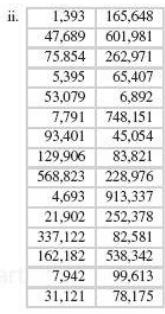
Is it normal? Is it reasonable to treat the following sample as though it comes from an approximately normal population? Explain.
Find the z-score: Find the zscore for which the area to its right is 0.89.
Your battery is dead: The lifetimes of a certain type of automobile battery are normally distributed with mean 5.9 years and standard deviation 0.4 year. The batteries are guaranteed to last at least 5 years. What proportion of the batteries fail to meet the guarantee?
Take your medicine: Medication used to treat a certain condition is administered by syringe. The target dose in a particular application is 10 milligrams. Because of the variations in the syringe, in reading the scale, and in mixing the fluid suspension. the actual dose administered is normally
Lightbulbs: The lifetime of lightbulbs has a mean of 1500 hours and a standard deviation of 100 hours. A sample of 50 lightbulbs is tested. a. What is the probability that the sample mean lifetime is greater than 1520 hours? b. What is the probability that the sample mean lifetime is less than 1540
More light bulbs: Someone claims to have developed a new lightbulb whose mean lifetime is 1800 hours with a standard deviation of 100 hours. A sample of 100 of these bulbs is tested. The sample mean lifetime is 1770 hours. a. If the claim is true, what is the probability of obtaining a sample mean
Pay your taxes: Among all the state income tax forms filed in a particular state, the mean income tax paid was p = $2000 and the standard deviation was a = $500. As part of a study of the impact of a new tax law, a sample of 80 income tax returns is examined. Would it be unusual for the sample mean
Safe delivery: A certain delivery truck can safely carry a load of 3400 pounds. The cartons that will be loaded onto the truck have a mean weight of 80 pounds with a standard deviation of 20 pounds. Forty cartons are loaded onto the truck.a. If the total weight of the 40 cartons is 3400 pounds,
Elementary school: In a certain elementary school. 52% of the students are girls. A sample of 65 students is drawn. a. What is the probability that more than 60% of them are girls? b. Would it be unusual for more than 70% of them to be girls?
Explain why P(a < X < b) is equal to P(a 5 × 5 b) when X is a continuous random variable.
Suppose that in a large class. the instructor announces that the average grade on an exam is 75. Which is more likely to be closer to 75: i. The exam grade of a randomly selected student in the class? ii. The mean exam grade of a sample of 10 students? Explain. S. Consider the formula for the
Explain how to decide when it is appropriate to use the normal approximation to the binomial distribution.
Describe the effect, if any. that the size of a sample has in assessing the normality of a population.
Compute the sample mean it and the sample standard deviation s.
Estimate the population mean p with I and the population standard deviation a with s. In other words, assume that the data are a sample from a normal population with mean p = and standard deviation a = s. Under this assumption, what proportion of cans will fail at a pressure of 90 or less?
Compute the sample mean: II and the sample standard deviation s for the second sample.
Using the same method as for the first sample. estimate the proportion of cans that will fail at a pressure of 90 or less.
The shipment will be accepted if we estimate that the proportion of cans that fail at a pressure of 90 or less is less than 0.001. Will this shipment be accepted?
Make a boxplot of the pressures for the second sample. Is the method appropriate for the second shipment?
Build more parking? A survey is to be conducted in which a random sample of residents in a certain city will be asked whether they favor or oppose the building of a new parking structure downtown. How many residents should be polled to be sure that a 90% confidence interval for the proportion who
A simple random sample of 140 residents in a certain town was polled the week after the Super Bowl, and 75 of them said they had watched the game on television.a. Construct a 95% confidence interval for the proportion of people in the town who watched the Super Bowl on television.b. The 2013 Super
Testing math skills: In order to test the effectiveness of a program to improve mathematical skills, a simple random sample of 45 fifth- graders was chosen to participate in the program. The students were given an exam at the beginning of the program and again at the end. The sample mean increase
In a sample of 87 young adults, the average time per day spent in bed asleep was 7.06 hours. Assume the population sample standard deviation is 1.11 hours.a. Construct a 99% confidence interval for the mean time spent in bed asleep.b. Some health experts recommend that people get 8 hours or more of
Leaking tanks: Leakage from underground fuel tanks has been a source of water pollution. In a random sample of 107 gasoline stations, 18 were found to have at least one leaking underground tank.a. Find a point estimate for the proportion of gasoline stations with at least one leaking underground
Waist size: According to the National Health Statistics Reports, a sample of 783 men aged 20– 29 years had a mean waist size of 36.9 inches with a standard deviation of 8.8 inches. a. Construct a 95% confidence interval for the mean waist size. b. The results of another study suggest that the
Drill lifetime: A sample of 50 drills had a mean lifetime of 12.68 holes drilled when drilling a low- carbon steel. Assume the population standard deviation is 6.83.a. Construct a 95% confidence interval for the mean lifetime of this type of drill.b. The manufacturer of the drills claims that the
Cost of environmental restoration: In a survey of 189 Scottish voters, 61 said they would be willing to pay additional taxes in order to restore the Affric forest.a. Assuming that the 189 voters who responded constitute a random sample, construct a 99% confidence interval for the proportion of
More repairs: A samplea component showed the following costs: 93 97 27 79 81 87 a. Construct a 90% confidence interval for the mean cost of a repair for this type of component. b. Is there any evidence to suggest that this confidence interval may not be reliable? Explain.
Contaminated water: Polychlorinated biphenyls (PCBs) are a group of synthetic oil- like chemicals that were at one time widely used as insulation in electrical equipment and were discharged into rivers. They were discovered to be a health hazard, and were banned in the 1970s. Assume that water
Defective electronics: A simple random sample of 200 electronic components was tested, and 17 of them were found to be defective.a. Construct a 99% confidence interval for the proportion of components that are defective.b. Use the results from the sample of 200 to estimate the sample size needed so
A sample of eight repair records for a certain fiber- optic component was drawn, and the with the following results: 30 35 19 23 27 22 26 16 a. Construct a dotplot for these data. Are the assumptions for constructing a confidence interval for the mean satisfied? Explain. b. If appropriate,
Cost of repairs: Refer to Exercise 8. Assume the population is normal. Construct a 95% confidence interval for the population standard deviation. .
Explain the difference between confidence and probability. In Exercises 4 and 5, express the following survey results in terms of confidence intervals for p:
When constructing a confidence interval for. , how do you decide whether to use the t distribution or the normal distribution? Are there any circumstances when it is acceptable to use either distribution?
It is stated in the text that there are many different t distributions. Explain how this is so.
For each of the four pollutants, construct a boxplot for the values for Year 1 to verify that the assumptions for constructing a confidence interval are satisfied.
Construct a 95% confidence interval for the mean level of each pollutant for the Year1. 3. Is it reasonable to conclude that the mean levels in Year 1 were lower than the baseline levels for some or all of the pollutants? Which ones, if any? The investigators were concerned that the reduction in
The Earth is closest to the Sun in January, but January is cold in the Northern Hemisphere. Explain.
Interpret computer output: The following output from MINITAB presents the results of a hypothesis test.a. What are the null and alternate hypotheses? b. What is the value of the test statistic? c. What is the P-value? d. Do you reject Ho at the a = 0.05 level? e. Do you reject Ho at the a = 0.01
Interpret calculator display: The following 11-84 Plus display presents the results of a hypothesis testa. Is this a test for a mean, a proportion, or a standard deviation?b. What are the null and alternate hypotheses?c. What is the value of the test statistic? (I. What is the P-value?d. Do you
How many TV sets? A survey organization sampled 60 households in a community and found that the sample mean number of TV sets per household was 3.1. The population standard deviation is a = 1.5. Can you conclude that the mean number of TV sets per household is greater than 3?a. State the null and
Crackers: Boxes of crackers are filled by a machine. The weights of a random sample of 25 boxes of crackers have standard deviation s = 5 grams. Assume the weights are normally distributed. Can you conclude that the population standard deviation is less than 10 grams? Use the a = 0.05 level of
A housing official in a certain city claims that the mean monthly rent for apartments in the city is more than $1000. To verify this claim, a simple random sample of 40 renters in the city was taken, and the sample mean rent paid was $1100 with a sample standard deviation of $300. Can you conclude
What's the news? The Pew Research Center reported in 2012 that 23% of 18- to 29-year-olds watch a cable news channel regularly. The director of media relations at a large university wants to know whether the population proportion of cable news viewers among students at her university is greater
Scoring runs: In 2012. the mean number of runs scored by both teams in a Major League Baseball game was 8.62. Following are the numbers of runs scored in a sample of 24 games in 2013.a. Construct a boxplot of the data. Is it appropriate to perform a hypothesis test?b. If appropriate, perform a
Facebook: A popular blog reports that 60% of college students log in to Facebook on a daily basis. The Dean of Students at a certain university thinks that the proportion may be different at her university. She polls a simple random sample of 200 students. and 134 of them report that they log in to
Playing the market: The Russell 2000 is a group of 2000 small-company stocks. On June 21. 2011 a random sample of 35 of these stocks had a mean price of $26.89, with a standard deviation of $23.41. A stock market analyst predicted that the mean price of all 2000 stocks would be $25.00. Can you
Power: A test of Ho: p = 100 versus If f. p > 100 will be made at a significance level of a = 0.01. The population standard deviation is a = 50 and the sample size is n = 75. Find the power of the test against the alternative pi = 110. 6. More power: Refer to Exercise 5. If the test is made at
Household size: For the past several years. The mean number of people in a household has been declining. A social scientist believes that in a certain large city, the mean number of people per household is less than 2.5. To investigate this, she takes a simplea. What are the null and alternate
Job satisfaction: In 2012, the General Social Survey sampled 762 employed people and asked them how satisfied they were with their jobs. Of the 762 people sampled. 386 said that they were completely satisfied or wry satisfied with their jobs. Can you conclude that more than 45% of employed people
Sugar content: The sugar content in milligrams of a syrup used to pack canned fruit is measured for 8 batches of syrup. The measurements are normally distributed, and the sample standard deviation is s = 3. Can you conclude that the population standard deviation is greater than 2? Use the a = 0.01
A result is significant at the 0.01 level. Explain why it must also be significant at the 0.05 level.
Why is it important to report the P-value or the test statistic when presenting the results of a hypothesis test?
Why don't we need to know the population standard deviation when performing a test about a population proportion?
If there have been no temperature trends over the years, then it will be equally likely for the record high or the record low to be more recent. If there has been a warming trend, it might be more likely for the record high to be more recent. Let p be the probability that the record high occurred
We will perform another test to determine whether record highs are more likely to have occurred recently. If a record high is equally likely to occur in any year of observation, the mean year in which a record is observed would occur at the midpoint of the observation period, which is (1871 +
For some records, marked with a *. the record temperature occurred more than once. In these cases, only the most recent year is listed. Explain how this might cause the mean to be greater than the midpoint of 1942, even if records are equally likely to occur in any year.
Using the data in Table 9.4, drop the dates in which the record high occurred more than once, and test the hypothesis in Exercise 3 again. Does your conclusion change?
Explain why using data for every day may violate the assumption, used in Exercise I. that the data are a simple random sample.
I latching shrimp eggs: A study of the effect of water pollution on the habitat of shrimp reported that out of 1985 eggs produced by shrimp at the Diesel Creek site in Charleston, South Carolina. 1919 hatched, and at the Shipyard Creek site, also in Charleston, 4561 out of 4988 eggs hatched.
The following 11-84 Plus calculator display presents a 95% confidence interval for the difference between two means. The sample sizes are ni = 85 and n2 = 71.a. Find the point estimate of PI €” P2.b. How many degrees of freedom did the calculator use?c. Fill in the blanks: We are 95% confident
The following MINITAB output display presents a 95% confidence interval for the difference between two means.a. Find the point estimate of pi €” p2.b. How many degrees of freedom did MINITAB use?c. Fill in the blanks: We are confident that the difference between the means is between and___
The following TI-84 Plus calculator display presents a 95% confidence interval for the difference between two proportions.a. Find the point estimate of pt €”p2.b. Fill in the blanks: We are 95% confident that the difference between the proportions is between and______
Interpret computer output: The following MINITAB output presents a confidence interval for the difference between two proportions.a. Find the point estimate of pt -P2€¢ b. Fill in the blanks: We are and confident that the difference between the proportions is between and _______
Interpret calculator display: The following TI-84 Plus calculator display presents a 95% confidence interval for the mean difference between matched pairs.a. Find the point estimate of Pd.b. How many degrees of freedom are there?c. Fill in the blanks: We are 959 confident that the mean difference
Interpret computer output: The following output from MINI TAB presents a confidence interval for the mean difference between matched pairs.a. Find the point estimate of pd. b. How many degrees of freedom are there? c. Fill in the blanks: We are confident that the mean difference is between and
A simple random sample of 7 people embarked on a program of regular aerobic exercise. Their heart rates, in beats per minute, were measured before and after, with the following results:Construct a 95% confidence interval for the mean reduction in heart rate.
College tuition: Independent random samples of private college and university tuition and fees for the 2012-2013 academic year from California and New York yielded the following data, in dollars.Construct a 95% confidence interval for the difference between the mean amounts of tuition in the two
Recovery time from surgery: A new postsurgical treatment is being compared with a standard treatment. Seven subjects receive the new treatment, while seven others (the controls) receive the standard treatment. The recovery times, in days. are given below.
Showing 37300 - 37400
of 88243
First
367
368
369
370
371
372
373
374
375
376
377
378
379
380
381
Last
Step by Step Answers
.png)
.png)
.png)
.png)
.png)
.png)
.png)
.png)
.png)
.png)
.png)
.png)
.png)

