New Semester
Started
Get
50% OFF
Study Help!
--h --m --s
Claim Now
Question Answers
Textbooks
Find textbooks, questions and answers
Oops, something went wrong!
Change your search query and then try again
S
Books
FREE
Study Help
Expert Questions
Accounting
General Management
Mathematics
Finance
Organizational Behaviour
Law
Physics
Operating System
Management Leadership
Sociology
Programming
Marketing
Database
Computer Network
Economics
Textbooks Solutions
Accounting
Managerial Accounting
Management Leadership
Cost Accounting
Statistics
Business Law
Corporate Finance
Finance
Economics
Auditing
Tutors
Online Tutors
Find a Tutor
Hire a Tutor
Become a Tutor
AI Tutor
AI Study Planner
NEW
Sell Books
Search
Search
Sign In
Register
study help
mathematics
statistics
Basic Statistics for the Behavioral Sciences 6th edition Gary W. Heiman - Solutions
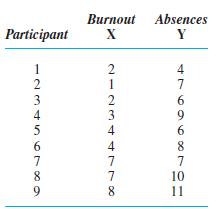
You want to know if a nurse’s absences from work in one month (Y) can be predicted by knowing her score on a test of psychological “burnout” (X). What do you conclude from the following ratio data?
(a) You have collected data that you think show a relationship. What do you do next? (b) What is the advantage of computing a correlation coefficient? (c) What two characteristics of a linear relationship are described by a correlation coefficient?
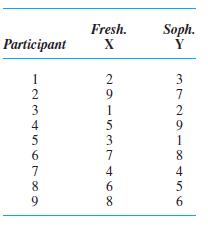
In the following data, the X scores reflect participants’ rankings in a freshman class, and the Y scores reflect their rankings in a sophomore class. To what extent do these data form a linear relationship?
A researcher observes the behavior of a group of monkeys in the jungle. He deter-mines each monkey€™s relative position in the dominance hierarchy of the group (1being most dominant) and also notes each monkey€™s relative weight (1 being the lightest). What is the relationship
In an experiment, (a) Which variable is assumed to be the causal variable? (b) Which variable is assumed to be caused? (c) Which variable does the researcher manipulate? (d) Which variable occurs first?
In a correlational study, we measure participants’ creativity and their intelligence. (a) Which variable does the researcher manipulate? (b) Which variable is the causal variable? (c) Which variable occurred first? (d) Which variable is called the independent variable?
In question 23, (a) How would you determine which variable to call X? (b) In a different study, my title is “Creativity as a function of Intelligence.” Which variable is my X variable? Why?
Indicate which of the following is a correlational design and the correlation coefficient to compute. (a) We measure participants’ age and their daily cell phone usage. (b) We separate participants into three age groups, and then observe their cell phone usage during a one hour period. (c) A
Why can’t you obtain a correlation coefficient greater than ±1?
(a) Define a positive linear relationship. (b) Define a negative linear relationship. (c) Define a curvilinear relationship.
As the value of r approaches ±1, what does it indicate about the following? (a) The consistency in the X-Y pairs; (b) The variability of the Y scores at each X; (c) The closeness of Y scores to the regression line; (d) The accuracy with which we can predict Y if X is known.
What does a correlation coefficient equal to 0 indicate about the four characteristics in question 8? In Question 8 (a) The consistency in the X-Y pairs; (b) The variability of the Y scores at each X; (c) The closeness of Y scores to the regression line; (d) The accuracy with which we can predict Y
(a) What are the two statistical names for r2? (b) How do you interpret r2?
What research steps must you go through to use the relationship between a person’s intelligence and grade average in high school so that, if you know a person’s IQ, you can more accurately predict the person’s grade average?
We find that the correlation between math ability (X ) and musical aptitude scores (Y) is r = +.44. The standard error of the estimate is SY, = 3.90. Bubbles has a math score of 60 and Foofy a score of 72. (a) Based on their math scores, who is predicted to have the higher music score and why?
(a) Explain conceptually why the proportion of variance accounted for equals 1.0 with a perfect correlation. (b) Why should you expect most relationships to account for only about 9% to 25% of the variance?
Poindexter finds r = -.80 when correlating number of hours studied and number of errors made on a statistics test. He also finds r = + .40 between speed of taking the test and number of errors on the test. He concludes that hours studied forms twice as strong a relationship and is therefore twice
(a) In question 16 what advanced statistical procedures can Poindexter employ to improve his predictions about test errors even more? (b) Say that the resulting correlation coefficient is .67. Using the proportion of variance accounted for, explain what this means.
A researcher finds that the correlation between variable A and variable B is r = + .20. She also finds that the correlation between variable C and variable B is r = — .40. Which relationship is scientifically more useful and by how much?
You measure how much people are initially attracted to a person of the opposite sex and how anxious they become during their first date. For the following ratio data, answer the questions below.(a) Compute the statistic that describes the relationship here. (b) Compute the linear regression
(a) For the relationship in question 19, what is the proportion of variance accounted for?(b) What is the proportion of variance not accounted for?(c) Why is or is not this a valuable relationship?
In question 19 of the Application Questions in Chapter 7, we correlated “burnout” scores (X) with absenteeism scores (Y). Using those data: (a) Compute the linear regression equation. (b) Compute the standard error of the estimate. (c) For a burnout of 4, what absence score is predicted? (d)
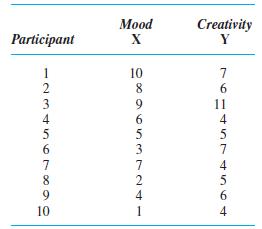
A researcher measures how positive a person’s mood is and how creative he or she is, obtaining the following interval scores:(a) Compute the statistic that summarizes this relationship.(b) What is the predicted creativity score for anyone scoring 3 on mood?(c) If your prediction is in error, what
Dorcas complains that it is unfair to use SAT scores to determine college admittance because she might do much better in college than predicted. (a) What statistic(s) will indicate whether her complaint is likely to be correct? (b) In reality, the positive correlation coefficient between SAT scores
(a) How are experiments and correlational designs similar in their purpose? (b) What is the distinguishing characteristic between an experiment and a correlational study?
In the typical experiment, (a) Do we group the scores to summarize them, and if so how? (b) What are the two descriptive statistics we compute for the summary?
In the typical correlational design,(a) Do we group the scores to summarize them, and if so how?(b) What are the three descriptive statistics we compute for the summary?
In a typical experiment, a researcher says she has found a good predictor(a) What name do we give to this variable?(b) Scores on which variable are being predicted?(c) For particular participants, what score will be used as the predicted score?(d) What statistic describes the “average” error in
In a typical correlational study, a researcher says he has found a good predictor(a) What name do we give to this variable?(b) Scores on which variable are being predicted?(c) For a particular participant, what score will be the predicted score?(d) What statistic describes the “average” error
You know that a relationship accounts for a substantial amount of variance. What does this tell you about (a) Its strength? (b) The consistency that a particular Y is paired with only one X, (c) The variability in Y scores at each X? (d) How closely the scatterplot hugs the regression line?
What is the general form of the linear regression equation? Identify its component symbols.
(a) What does the Y intercept indicate? (b) What does the slope indicate?
(a) What is the name for SY,? (b) What does SY, tell you about the spread in the Y scores? (c) What does SY, tell you about your errors in prediction?
(a) What two assumptions must you make about the data in order for the standard error of the estimate to be accurate, and what does each mean?(b) How does heteroscedasticity lead to an inaccurate description of the data?
How is the value of SY, related to the size of r? Why?
(a) What does probability convey about an event’s occurence in a sample? (b) What is the probability of a random event based on?
Four airplanes from different airlines have crashed in the past two weeks. This terrifies Bubbles, who must travel on a plane. Her travel agent claims that the probability of a plane crash is minuscule. Who is correctly interpreting the situation? Why?
(a) Why does random sampling produce representative samples? (b) Why does random sampling produce unrepresentative samples?
In the population of typical college students, µ = 75 on a statistics final exam (σx = 6.4) .For 25 students who studied statistics using a new technique, X = 72.1. Using two tails of the sampling distribution and the .05 criterion: (a) What is the critical value? (b) Is this sample in the
In a population, µ = 100 and σx = 25. A sample (N = 150) has X = 102. Using two tails of the sampling distribution and the .05 criterion:(a) What is the critical value?(b) Is this sample in the region of rejection? How do you know?(c) What does this indicate about the likelihood of this sample
The mean of a population of raw scores is 33 (σx = 12). Use the criterion of .05 and the upper tail of the sampling distribution to test whether a sample with X = 36.8 (N = 30) represents this population. (a) What is the critical value? (b) Is the sample in the region of rejection? How do you
We obtain a X = 46.8 (N = 15) which may represent the population where µ = 50 (σx = 11). Using the criterion of .05 and the lower tail of the sampling distribution:(a) What is our critical value?(b) Is this sample in the region of rejection? How do you know?(c) What should we conclude about the
The mean of a population of raw scores is 28 (σx = 9).Your X is 34 (with N = 35) .Using the .05 criterion with the region of rejection in both tails of the sampling distribution, should you consider the sample to be representative of this population? Why?
The mean of a population of raw scores is 48 (σx = 16).Your X is 44 (with N = 40) .Using the .05 criterion with the region of rejection in both tails of the distribution, should you consider the sample to be representative of this population? Why?
On a standard test of motor coordination, a sports psychologist found that the population of average bowlers had a mean score of 24, with a standard deviation of 6. She tested a random sample of 30 bowlers at Fred’s Bowling Alley and found a sample mean of 26. A second random sample of 30 bowlers
(a) In question 20, if a particular sample does not represent the population of average bowlers, what is your best estimate of the µ of the population it does represent?(b) Explain the logic behind this conclusion.
In a study you obtain the following data representing the aggressive tendencies of some football players:40 30 39 40 41 39 31 28 33(a) Researchers have found that in the population of non-football players, µ is 30 (σx = 5.) Using both tails of the sampling distribution, determine whether your
We reject that a sample, with X = 95, is merely poorly representing the population where µ = 100.(a) What is our best estimate of the population µ that the sample is representing?(b) Why can we claim this value of µ? (Ch. 4)
For a distribution in which X = 43 and SX = 8, using z-scores, what is the relative frequency of (a) Scores below 27? (b) Scores above 51? (c) A score between 42 and 44? (d) A score below 33 or above 49? (e) For each of the questions above, what is the probability of randomly selecting participants
When we compute the z-score of a sample mean,(a) What must you compute first?(b) What is its formula?(c) What is the formula for the z-score of a sample mean?
The mean of a population of raw scores is 50 (σx = 18). (a) Using the z-table, what is the relative frequency of sample means below 46 when N = 40? (b) What is the probability of randomly selecting a sample of 40 scores having a X below 46?
The mean of a population of raw scores is 18 (σx = 12).(a) Using the z-table, what is the relative frequency of sample means above 24 when N = 30?(b) What is the probability of randomly selecting a sample of 30 participants whose scores produce a mean above 24?
(a) What is sampling with replacement? (b) What is sampling without replacement? (c) How does sampling without replacement affect the probability of events, compared to sampling with replacement?
(a) When are events independent? (b) When are they dependent?
When testing the representativeness of a sample mean,(a) What is the criterion probability?(b) What is the region of rejection?(c) What is the critical value?
What is the difference between using both tails versus one tail of the sampling distribution in terms of(a) The size of the region of rejection?(b) The critical value?
Poindexter’s uncle is building a house on land that has been devastated by hurricanes 160 times in the past 200 years. However, there hasn’t been a major storm there in 13 years, so his uncle says this is a safe investment. His nephew argues that he is wrong because a hurricane must be due
(a) What are the advantage and disadvantage of two-tailed tests? (b) What are the advantage and disadvantage of one-tailed tests?
Describe the experimental hypotheses and the independent and dependent variables when we study: (a) Whether the amount of pizza consumed by college students during finals week increases relative to the rest of the semester, (b) Whether breathing exercises alter blood pressure, (c) Whether
For each study in question 11, indicate whether a one- or a two-tailed test should be used and state the H0 and Ha. Assume that µ = 50 when the amount of the independent variable is zero.
Listening to music while taking a test may be relaxing or distracting. We test 49 participants while listening to music, and they produce an X = 54.36. The mean of the population taking this test without music is 50 (aX = 12).(a) Is this a one tailed or two-tailed test? Why?(b) What are our H0 and
We ask whether attending a private school leads to higher or lower performance on a test of social skills. A sample of 100 students from a private school produces a mean of 71.30 on the test, and the national mean for students from public schools is 75.62 (σX = 28.0).(a) Should we use a one-tailed
(a) In question 13, what is the probability that we made a Type I error? What would be the error in terms of the independent and dependent variables? (b) What is the probability that we made a Type II error? What would be the error in terms of the independent and dependent variables?
(a) In question 14, what is the probability that we made a Type I error? What would be the error in terms of the independent and dependent variables?(b) What is the probability that we made a Type II error? What would be the error in terms of the independent and dependent variables?
Foofy claims that a one-tailed test is cheating because we use a smaller zcrit, and therefore it is easier to reject H0 than with a two-tailed test. If the independent variable doesn’t work, she claims, we are more likely to make a Type I error. Why is she correct or incorrect?
Poindexter claims that the real cheating occurs when we increase power by increasing the likelihood that results will be significant. He reasons that if we are more likely to reject H0, then we are more likely to do so when H0 is true. Therefore, we are more likely to make a Type I error. Why is he
Bubbles reads that in study A the zobt = +1.97, p < .05. She also reads that in study B the zobt = +14.21, p < .0001. (a) She concludes that the results of study B are way beyond the critical value used in study A, falling into a region of rejection containing only .0001 of the sampling
A report indicates that brand X toothpaste significantly reduced tooth decay relative to other brands, with p < .44.(a) What does “significant” indicate about the researcher’s decision about brand X?(b) What makes you suspicious of the claim that brand X works better than other brands?
We ask if the attitudes toward fuel costs of 100 owners of hybrid electric cars(X = 76) are different from those on a national survey of owners of non-hybrid cars (p = 65, σX = 24). Higher scores indicate a more positive attitude.(a) Is this a one- or two-tailed test?(b) In words what is H0 and
We ask if visual memory ability for a sample of 25 art majors (X = 49) is better than that of engineers who, on a nationwide test, scored p = 45 and σX = 14. Higher scores indicate a better memory.(a) Is this a one- or two-tailed test?(b) In words what is H0 and Ha?(c) Perform the z-test.(d) What
(a) Summarize your sample data.(b) Is this a one-tailed or two-tailed test? Why?(c) What are H0 and Ha?(d) Compute zobt.(e) With a = .05, what is zcrit?(f) What should we conclude about the relationship here? (Chs. 4, 5, 10)
(a) What is the difference between the independent variable and the dependent variable in an experiment? (b) When the assumptions of a procedure require normally distributed interval/ratio scores, are we referring to scores on the independent or dependent variable? (c) What distinguishes an
For the following, identify the independent variable and the dependent variable and explain why we should use a parametric or nonparametric procedure? (a) When ranking the intelligence of a group of people given a smart pill. (b) When comparing the median income for a group of college professors to
We have a X of 40 under the condition of people tested in the morning versus a X of 60 for people tested in the evening. Assuming they accurately represent their populations, how do you envision this relationship in the population? 28.
(a) What does a sampling distribution of means show? (b) A mean having a z beyond ±1.96 is where? (c) How often do means in the region of rejection occur when dealing with a particular raw score population? (d) What does this tell you about your mean?
(a) Why do researchers want to discover relationships?(b) What is the difference between a real relationship and one produced by sampling error?
(a) Why can no statistical result prove that changing the independent variable causes the dependent scores to change? (b) What one thing does a significant result prove?
(a) What are the two major categories of inferential procedures? (b) What characteristics of your data determine which you should use? (c) What happens if you seriously violate the assumptions of a procedure? (d) What is a statistical reason to design a study so you can use parametric procedures?
(a) What does H0 communicate? (b) What does Ha communicate?
(a) When do you use a one-tailed test? (b) When do you use a two-tailed test?
(a) What does “significant” convey about the results of an experiment? (b) Why is obtaining significant results a goal of behavioral research? (c) Why is declaring the results significant not the final step in a study?
(a) What is power? (b) Why do researchers want to maximize power? (c) What result makes us worry whether we have sufficient power? (d) Why is a one-tailed test more powerful than a two-tailed test?
(a) What are the three aspects of maximizing the power of a t-test?(b) What are the three aspects of maximizing the power of a correlation coefficient?
We ask whether a new version of our textbook is beneficial or detrimental to students learning statistics. On a national statistics exam, µ = 68.5 for students using other textbooks. A sample of students using this book has the following scores: 64 69 92 77 71 99 82 74 69 88 (a) What are H0 and Ha
A researcher predicts that smoking cigarettes decreases a person’s sense of smell. On a test of olfactory sensitivity, the µ for nonsmokers is 18.4. A sample of people who smoke a pack a day produces these scores:1614191716181715181912 14(a) What are H0 and Ha for this study?(b) Compute
Foofy studies if hearing an argument in favor of an issue alters participants’ attitudes toward the issue one way or the other. She presents a 30-second argument to 8 people. In a national survey about this issue, µ = 50. She obtains X = 53.25 and sX = 569.86. (a) What are H0 and Ha? (b) What is
In question 13,(a) What statistical principle should Foofy be concerned with?(b) Identify three problems with her study from a statistical perspective.(c) Why would correcting these problems improve her study?
Poindexter examined the relationship between ratio scores measuring the quality of sneakers worn by volleyball players and their average number of points scored per game. Studying 10 people who owned sneakers of good to excellent quality, he computed r = + .21. Without further ado, he immediately
Eventually, for the study in question 15, Poindexter reported that r(8) = +.21, p > .05. (a) What should he conclude about this relationship? (b) What other computations should he perform to describe the relationship in these data? (c) What statistical goal described in this chapter should he be
A scientist suspects that as a person’s stress level changes, so does the amount of his or her impulse buying. With N = 72, his r is + .38. (a) What are H0 and H0? (b) With a = .05, what is rcrit? (c) Report these results using the correct format. (d) What conclusions should he draw? (e) What
Foofy computes the correlation between an individual’s physical strength and his or her college grade point average. Using a computer, the correlation for a sample of 2000 people is r(1998) = + .08, p = < .0001. She claims this is a useful tool for predicting which college applicants are
We study the influence of wearing uniforms in middle school on attitudes toward achieving good grades. On a national survey, the average attitude score for students who do not wear uniforms is µ = 12. A sample of students who wear uniforms has scores of 8, 12, 10, 9, 6, and 7. Perform all parts of
In this chapter, you learned how to perform four different statistical procedures. List them.
A newspaper article claims that the academic rank of a college is negatively related to the rank of its football team. From a sample of 28 colleges, you obtain a correlation coefficient of - .32.(a) Which type of correlation coefficient did you compute?(b) What are H0 and Ha?(c) With a = .05, what
(a) How would you report your results if a = .05, N = 43, and tobt = +6.72 is significant? (b) How would you report your results if a = .05, N = 6, and tobt = -1.72 is not significant?
While reading a published research report, you encounter the following statements. For each, identify the N, the procedure performed and the outcome, the relationship, and the type of error possibly being made.(a) “When we examined the perceptual skills data, the mean of 55 for the sample of
You wish to compute the 95% confidence interval for a sample with a df of 80. Using interpolation, determine the tcrit that you should use.
In a two-tailed test, N is 35.(a) Is the tobt of +2.019 significant?(b) Is the tobt of +4.0 significant?
(a) Why must a relationship be significant to be important? (b) Why can a relationship be significant and still be unimportant?
(a) What is the difference between the purpose of descriptive and inferential statistics? (b) When should you should use a parametric versus a nonparametric inferential procedure?
Showing 37000 - 37100
of 88243
First
364
365
366
367
368
369
370
371
372
373
374
375
376
377
378
Last
Step by Step Answers
.png)
.png)