New Semester
Started
Get
50% OFF
Study Help!
--h --m --s
Claim Now
Question Answers
Textbooks
Find textbooks, questions and answers
Oops, something went wrong!
Change your search query and then try again
S
Books
FREE
Study Help
Expert Questions
Accounting
General Management
Mathematics
Finance
Organizational Behaviour
Law
Physics
Operating System
Management Leadership
Sociology
Programming
Marketing
Database
Computer Network
Economics
Textbooks Solutions
Accounting
Managerial Accounting
Management Leadership
Cost Accounting
Statistics
Business Law
Corporate Finance
Finance
Economics
Auditing
Tutors
Online Tutors
Find a Tutor
Hire a Tutor
Become a Tutor
AI Tutor
AI Study Planner
NEW
Sell Books
Search
Search
Sign In
Register
study help
mathematics
statistics
Statistics For Managers Using Microsoft Excel 7th Edition David M. Levine, David F. Stephan, Kathryn A. Szabat - Solutions
One operation of a mill is to cut pieces of steel into parts that will later be used as the frame for front seats in an automobile. The steel is cut with a diamond saw and requires the resulting parts to be within ±0.005 inch of the length specified by the automobile company. Data are collected
A manufacturing company produces steel housings for electrical equipment. The main component part of the housing is a steel trough that is made out of a 14-gauge steel coil. It is produced using a 250-ton progressive punch press with a wipe-down operation that puts two 90-degree forms in the flat
The manufacturing company in Problem 2.18 also produces electric insulators. If the insulators break when in use, a short circuit is likely to occur. To test the strength of the insulators, destructive testing in high-powered labs is carried out to determine how much force is required to break the
The following data represent the responses to two questions asked in a survey of 40 college students majoring in business: What is your gender? (M = male; F = female) and What is your major? (A = Accounting; C = Computer Information Systems; M = Marketing):a. Tally the data into a contingency table
The file Bulbs contains the life (in hours) of a sample of 40 100-watt light bulbs produced by Manufacturer A and a sample of 40 100-watt light bulbs produced by Manufacturer B. The following table shows these data as a pair of ordered arrays:a. Construct a frequency distribution and a percentage
The file Drink contains the following data for the amount of soft drink (in liters) in a sample of 50 2-liter bottles:a. Construct a cumulative percentage distribution.b. On the basis of the results of (a), does the amount of soft drink filled in the bottles concentrate around specific values?
A survey asked 1,264 women who were their most trusted shopping advisers. The survey results were as follows:a. Construct a bar chart, a pie chart, and a Pareto chart.b. Which graphical method do you think is best for portraying these data?c. What conclusions can you reach concerning women's most
What do college students do with their time? A survey of 3,000 traditional-age students was taken, with the results as follows:ActivityPercentage (%)Attending class/lab........................ 9Sleeping.....................................24Socializing, recreation,
The Energy Information Administration reported the following sources of electricity in the United States in 2011:a. Construct a par b. What percentage of power is derived from coal, nuclear power, or natural gas? c. Construct a pie chart. d. For these data, do you prefer using a Pareto chart or a
An article discussed radiation therapy and new cures from the therapy, along with the harm that could be done if mistakes were made. The following tables represent the results of the types of mistakes made and the causes of mistakes reported to the New York State Department of Health from 2001 to
The following table indicates the percentage of residential electricity consumption in the United States, in a recent yeara. Construct a bar chart, a pie chart, and a Pareto chart. b. Which graphical method do you think is best for portraying these data? c. What conclusions can you reach concerning
IBM's revenue was $24.7 billion in the first quarter of 2012. The revenue categorized by business segment was as follows:a. Construct a bar chart and a pie chart.b. What conclusions can you reach concerning IBM's revenue during the first quarter of 2012?
A survey of 1,085 adults asked "Do you enjoy shopping for clothing for yourself?" The results indicated that 51 % of the females enjoyed shopping for clothing for themselves as compared to 44% of the males. (Data extracted from "Split Decision on Clothes Shopping," USA Today, January 28, 2011, p.
Each day at a large hospital, hundreds of laboratory tests are performed. The rate of "non conformances," tests that were done improperly (and therefore need to be redone), has seemed to be steady, at about 4%. In an effort to get to the root cause of the non conformances, the director of the lab
Do social recommendations increase ad effectiveness? A study of online video viewers compared viewers who arrived at an advertising video for a particular brand by following a social media recommendation link to viewers who arrived at the same video by web browsing. Data were collected on whether
Construct a stem-and-leaf display, given the following data from a sample of midterm exam scores in finance:54 69 98 93 53 74
The following is a stem-and-leaf display representing the amount of gasoline purchased, in gallons (with leaves in tenths of gallons), for a sample of 25 cars that use a particular service station on the New Jersey Turnpike:a. Construct an ordered array.b. Which of these two displays seems to
The file BBcost2011 contains the total cost (in $) for four tickets, two beers, four soft drinks, four hot dogs, two game programs, two baseball caps, and parking for one vehicle at each of the 30 Major League Baseball parks during the 2011 season. Source: Data extracted from
The file BBcost2011 contains the cost (in $) per serving of 30 grams for a sample of 18 chocolate chip cookies:a. Construct an ordered array.b. Construct a stem-and-leaf display.c. Does the ordered array or the stem-and-leaf display provide more information? Discuss.d. Around what value, if any, is
The file contains the following data about the cost of electricity during July 2012 for a random sample of 50 one-bedroom apartments in a large city: a. Construct a histogram and a percentage polygon. b. Construct a cumulative percentage polygon. c. Around what amount does the monthly electricity
One operation of a mill is to cut pieces of steel into parts that will later be used as the frame for front seats in an automobile. The steel is cut with a diamond saw and requires the resulting parts to be within ±0.005 inch of the length specified by the automobile company. The data are
A manufacturing company produces steel housings for electrical equipment. The main component part of the housing is a steel trough that is made out of a 14-gauge steel coil. It is produced using a 250-ton progressive punch press with a wipe-down operation that puts two 90-degree forms in the flat
The manufacturing company in Problem 2.40 also produces electric insulators. If the insulators break when in use, a short circuit is likely to occur. To test the strength of the insulators, destructive testing in high-powered labs is carried out to determine how much force is required to break the
The file Bulbs contains the life (in hours) of a sample of 40 100-watt light bulbs produced by Manufacturer A and a sample of 40 100-watt light bulbs produced by Manufacturer B. The following table shows these data as a pair of ordered arrays.Use the following class interval widths for each
The data stored in represents the amount of soft drink in a sample of 50 2-liter bottles.a. Construct a histogram and a percentage polygon.b. Construct a cumulative percentage polygon.c. On the basis of the results in (a) and (b), does the amount of soft drink filled in the bottles concentrate
The following is a set of data from a sample of n = 11 items:a. Construct a scatter plot.b. Is there a relationship between X and Y? Explain.
The following is a series of annual sales (in $millions) over an 11-year period (2001 to 2011):a. Construct a time-series plot.b. Does there appear to be any change in annual sales over time? Explain.
Movie companies need to predict the gross receipts of individual movies once a movie has debuted. The following results, stored in. are the first weekend gross, the, and the worldwide gross (in $millions) of the eight Harry Potter movies:a. Construct a scatter plot with first weekend gross on the X
Data were collected on the typical cost of dining at American-cuisine restaurants within a 1-mile walking distance of a hotel located in a large city. The file contains the typical cost (a per transaction cost in $) as well as a Bundle score, a measure of overall popularity and customer loyalty,
College basketball is big business, with coaches' salaries, revenues, and expenses in millions of dollars. The file College Basketball contains the coaches' salary and revenue for college salaries on the Taxis. a. Do you think schools with higher revenues also have higher coaches' salaries? b.
A Pew Research Center survey found that social networking is popular in many nations around the world. The file contains the level of social media networking (measured as the percentage of individuals polled who use social networking sites) and the GDP at purchasing power parity (PPP) per capita
The 2012 Data Breach Investigations Report (DBIR) is a recounting of the many facets of corporate data theft. In this document, the Verizon RISK Team reported that there were 855 data breaches in 2011; various external agents were responsible for 840 of them, summarized as follows:a. Compute the
How have stocks performed in the past? The following table presents the data stored in Stock Performance and shows the performance of a broad measure of stocks (by percentage) for each decade from the 1830s through the 2000s:a. Construct a time-series plot of the stock performance from the 1830s to
The data in New Home Sale represent number and median sales price of new single-family houses sold in the United States recorded at the end of each month from January 2000 through April 2012. (Data extracted from www.census. gov, June 1, 2012.) a. Construct a times series plot of new home sales
The file Movie Attendance contains the yearly movie attendance (in billions) from 2001 through 2011:a. Construct a time-series plot for the movie attendance (in billions). b. What pattern, if any, is present in the data?
The file contains the number of audits of corporations with assets of more than $250 million conducted by the Internal Revenue Service between 2001 and 2011. (Data extracted from www.irs.gov.) a. Construct a time-series plot. b. What pattern, if any, is present in the data?
Examine the following visual display, adapted from one that appeared in the World Happiness Report, distributed by the United Nations in April 2012, as reported by flowingdata.com.a. Describe at least one good feature of this visual display. b. Describe at least one bad feature of this visual
Examine the following visual display, adapted from one that appeared during a Fox News Channel broadcast in 2011, as reported by flowingdata.com.a. Describe at least one good feature of this visual display. b. Describe at least one bad feature of this visual display. c. Redraw the graph, using the
Examine the following visual display, adapted from one that appeared in the entry "Statistics of international development blogs and new plans for Kariobangi in 2012," on the kariobangi blog, kariobangi.wordpress.com, on January 3, 2012. a. Describe at least one good feature of this visual
The following table represents world oil pro in millions of barrels a day in the third quarter of 2011: a. Construct contingency tables based on total percentages, row percentages, and column percentages. b. What conclusions can you reach from these analyses?
Figure 2.1 shows a bar chart and a pie chart for what bosses demand during vacation time . a. Create an exploded pie chart, a doughnut chart, a cone chart, or a pyramid chart that shows what bosses demand during vacation time. b. Which graphs do you prefer-the bar chart or pie chart or the exploded
Figures 2.2 and 2.3 show a bar chart and a pie chart for the risk level for the retirement fund data.a. Create an exploded pie chart, a doughnut chart, a cone chart, and a pyramid chart that shows the risk level of retirement funds.b. Which graphs do you prefer-the bar chart or pie chart or the
Using the sample of retirement funds stored in Retirement Funds a. Construct a table that computes the average three-year return for each type, market cap, and risk. b. Drill down to examine the large cap growth funds with high risk. How many funds are there? What conclusions can you reach about
Using the sample of retirement funds stored in Retirement Funds a. Construct a table that tallies type, market cap, and rating. b. What conclusions can you reach concerning differences among the types of retirement funds (growth and value), based on market cap (small, mid-cap, and large) and the
Using the sample of retirement funds stored in a. Construct a table that tallies market cap, risk, and rating. b. What conclusions can you reach concerning differences among the types of funds based on market cap (small, mid-cap, and large), risk (low, average, and high), and the rating (one, two,
Using the sample of retirement funds stored in a. Construct a table that tallies type, risk, and rating. b. What conclusions can you reach concerning differences among the types of retirement funds (growth and value), based on the risk (low, average, and high), and the rating (one, two, three,
Using the sample of retirement funds stored in Retirement Funds a. Construct a table that tallies type, market cap, risk, and rating. b. What conclusions can you reach concerning differences among the types of funds based on market cap (small, mid-cap, and large), based on type (growth and value),
Using the sample of retirement funds stored in: what are the attributes of the fund with the highest five-year return?
Using the sample of retirement funds stored in: what five-year returns are associated with small market cap funds that have a rating of five stars?
A May 2012 survey of Millennials, people aged 18 to 30, explored that group's buying habits. Millennials who were identified as being likely to purchase a computer during the next six months were asked to indicate the brand of the computer they were likely to purchase. The responses were:a. Compute
Using the sample of retirement funds stored in: which funds in the sample have the lowest five-year return?
Using the sample of retirement funds stored in: what is the type and market cap of the five-star fund with the highest five-year return?
Using the sample of retirement funds stored in: what characteristics are associated with the funds that have the lowest five-year return?
What are the advantages and disadvantages of using a bar chart, a pie chart, and a Pareto chart? Discuss in detail.
Compare and contrast the bar chart for categorical data with the histogram for numerical data. Discuss.
A survey of 1,085 adults asked "Do you enjoy shopping for clothing for yourself?" The results indicated that 51% of the females enjoyed shopping for clothing for themselves as compared to 44% of the males. (Data extracted from "Split Decision on Clothes Shopping," USA Today, January 28, 2011, p.
What is the difference between a drill-down and a slicer?
The following summary table presents the breakdown of the price of a new college textbook:a. Using the four categories of publisher, bookstore, author, and freight, construct a bar chart, a pie chart, and a Pareto chart.b. Using the four subcategories of publisher and three subcategories of
The following table represents the market share (in number of movies, gross in millions of dollars, and millions of tickets sold) of each type of movie in 2011:a. construct a bar chart, a pie chart, and a pareto chart for the number of movies, gross (in $millions), and number of tickets sold (in
A survey was conducted from 665 consumer magazines on the practices of their websites. The results are summarized in a copyediting table and fact-checking table:a. For copyediting construct a bar chart, a pie chart, and a pareto chart.b. Which graphical method do you think is best for portraying
The owner of a restaurant that serves Continental-style entrees has the business objective of learning more about the patterns of patron demand during the Friday-to-Sunday weekend time period. Data were collected from 630 customers on the type of entree ordered and organized in the following
Suppose that the owner of the restaurant also wants to study the demand for dessert during the same time period. She decides that in addition to studying whether a dessert was ordered, she will also study the gender of the individual and whether a beef entree was ordered. Data were collected from
The following data represent the pounds per capita of fresh food and packaged food consumed in the United States, Japan, and Russia in a recent year:a. For the United States, Japan, and Russia, construct a bar chart, a pie chart, and a Pareto chart for different types of fresh foods consumed.b. For
Each day at a large hospital, hundreds of laboratory tests are performed. The rate of "non conformances," tests that were done improperly (and therefore need to be redone), has seemed to be steady, at about 4%. In an effort to get to the root cause of the non conformances, the director of the lab
Several years ago, a growing number of warranty claims on Firestone tires sold on Ford SUVs prompted Firestone and Ford to issue a major recall. An analysis of warranty claims data helped identify which models to recall. A breakdown of 2,504 warranty claims based on tire size is given in the
One of the major measures of the quality of service provided by an organization is the speed with which the organization responds to customer complaints. A large family-held department store selling furniture and flooring, including carpet, had undergone a major expansion in the past several years.
The file contains the percentage alcohol, number of calories per 12 ounces, and number of carbohydrates (in grams) per 12 ounces for 150 of the best-selling domestic beers in the United States.Source: Data extracted from www.beerl00.com/beercalories.htm, June 1,2012.a. Construct a percentage
The file contains the state cigarette tax ($) for each state as of January 1, 2012. a. Construct an ordered array. b. Plot a percentage histogram. c. What conclusions can you reach about the differences in the state cigarette tax between the states?
The file contains the yields for one-year certificates of deposit (CDs) and a five-year CDs for 24 banks in the United States, as of June 21, 2012. Source: Data extracted and compiled from www.Bankrate.com, June 21,2012. a. Construct a stem-and-leaf display for each variable. b. Construct a scatter
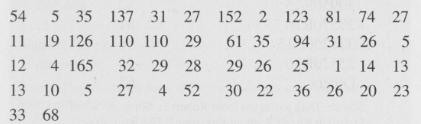
The file 14includes the total compensation (in $millions) for CEOs of 194 large public companies and the investment return in 2011. (Data extracted from nytimes.com/2012/06/17/business/executive-pay-still-climbing-despite-a-shareholder-din.html.) For total compensation: a. Construct a frequency
Studies conducted by a manufacturer of Boston and Vermont asphalt shingles have shown product weight to be a major factor in customers' perception of quality. Moreover, the weight represents the amount of raw materials being used and is therefore very important to the company from a cost
What was the average price of a room at two-star, three-star, and four-star hotels in cities around the world in 2011? The file contains the prices in English pounds Complete the following for two-star, three-star, and four-star hotels:a. Construct a frequency distribution and a percentage
The file Protein contains calorie and cholesterol information for popular protein foods (fresh red meats, poultry, and fish).Source: U.S. Department of Agriculture.a. Construct a percentage histogram for the number of calories.b. Construct a percentage histogram for the amount of cholesterol.c.
The file Natural Gas contains the monthly average wellhead and residential price for natural gas (dollars per thousand cubic feet) in the United States from January 1, 2008, to January 1, 2012. For the wellhead price and the residential price:a. Construct a time-series plot.b. What pattern, if any,
The following set of data is from a sample of n = 5:7 4 9 8 2a. Compute the mean, median, and mode.b. Compute the range, variance, standard deviation, and coefficient of variation.c. Compute the Z scores. Are there any outliers?d. Describe the shape of the data set. Discuss.
The file Fast food contains the amount that a sample of 15 customers spent for lunch ($) at a fast-food restaurant:7.42 6.29 5.83 6.50 8.34 9.51 7.10 6.80 5.90 4.89 6.50 5.52 7.90 8.30 9.60a. Compute the mean and median.b. Compute the variance, standard deviation, range, and
The file Sedans contains the overall miles per galk (MPG) of 2012 family sedans:38 24 26 21 25 22 24 34 23 20 37 22 20 33 22 21a. Compute the mean, median, and mode.b. Compute the variance, standard deviation, range, coefficient of variation, and Z scores.c. Are the data skewed? If so, how?d.
The file SUV contains the overall miles per gallon (MPG) of 2012 small SUVs:20 22 23 22 23 22 22 21 19 22 22 26 23 24 19 21 22 16a. Compute the mean, median, and mode.b. Compute the variance, standard deviation, range, coefficient of variation, and Z scores.c. Are the
The file Accounting Partners contains the number of partners in a cohort of rising accounting firms with fewer than 225 employees that have been tagged as "firms to watch." The firms have the following numbers of partners:24 32 12 13 29 30 26 17 15 21 16 23 21 19 30 14
The file Market Penetration contains the market penetration value (that is, the percentage of the country population that are users) for the 15 countries the lead the world in total number of Facebook users: 50.19 25.45 4.25 18.04 31.66 49.14 39.99 28.29 37.52 28.87 37.73 46.04 52.24
Is there a difference in the variation of the yields of different types of investments? The file CD Rate contains the yields for one-year certificates of deposit (CDs) and five-year CDs for 24 banks in the United States, as of June 21, 2012. Source: Data extracted from www.Bankrate.com, June 21,
The file Hotel Away contains the average room price (in US$) paid in 2011 by people of various nationalities while traveling away from their home country:171 166 159 157 150 148 147 146a. Compute the mean, median, and mode.b. Compute the range, variance, and standard deviation.c. Based
A bank branch located in a commercial district of a city has the business objective of developing an improved process for serving customers during the noon-to-l:00 P.M. lunch period. The waiting time, in minutes, is defined as the time the customer enters the line to when he or she reaches the
General Electric (GE) is one of the world's largest companies; it develops, manufactures, and markets a wide range of products, including medical diagnostic imaging devices, jet engines, lighting products, and chemicals. In 2010, the stock price rose 17.73%, and in 2011, the stock price rose
The following set of data is from a sample of n = 6:7 4 9 7 3 12a. Compute the mean, median, and mode.b. Compute the range, variance, standard deviation, and coefficient of variation.c. Compute the Z scores. Are there any outliers?d. Describe the shape of the data set. Discuss.
TASER International, Inc., develops, manufactures, and sells nonlethal self-defense devices known as Tasers and markets primarily to law enforcement, corrections institutions, and the military. TASER's stock price in 2010 increased by 1.08%, and in 2011, it increased by 2.4%. a. Compute the
The file Indices contains data that represent the yearly rate of return (in percentage) for the Dow Jones Industrial Average (DJIA), the Standard & Poor's 500 (S&P 500), and the technology-heavy NASDAQ Composite (NASDAQ) from 2008 through 2011. These data are:a. Compute the geometric mean rate of
In 2008 through 2011, the value of precious metals fluctuated dramatically. The data in the following table represent the yearly rate of return (in percentage) for platinum, gold, and silver from 2008 through 2011:a. Compute the geometric mean rate of return per year for platinum, gold, and silver
Using the three-year return percentage variable in Retirement Fundsa. Construct a table that computes the mean for each type, market cap, and risk.b. Construct a table that computes the standard deviation for each type, market cap, and risk.c. What conclusions can you reach concerning differences
Using the three-year return percentage variable in Retirement Funds a. Construct a table that computes the mean for each type, market cap, and rating. b. Construct a table that computes the standard deviation for each type, market cap, and rating. c. What conclusions can you reach concerning
Using the three-year return percentage variable in Retirement Fundsa. Construct a table that computes the mean for each market cap, risk, and rating.b. Construct a table that computes the standard deviation for each market cap, risk, and rating.c. What conclusions can you reach concerning
Using the three-year return percentage variable in Retirement Funds a. Construct a table that computes the mean for each type, risk, and rating. b. Construct a table that computes the standard deviation for each type, risk, and rating. c. What conclusions can you reach concerning differences among
The following is a set of data from a sample of n - 7: 12 7 4 9 0 7 3 a. Compute the first quartile (Q1), the third quartile (Q3), and the interquartile range. b. List the five-number summary. c. Construct a box plot and describe its shape. d. Compare your answer in (c) with that from
The following is a set of data from a sample of n - 6: 7 4 9 7 3 12 a. Compute the first quartile (Q]), the third quartile (Q3), and the interquartile range. b. List the five-number summary. c. Construct a box plot and describe its shape. d. Compare your answer in (c) with that from Problem
The following is a set of data from a sample of n = 5: 7 4 9 8 2 a. Compute the first quartile (Q1), the third quartile (Q3), and the interquartile range. b. List the five-number summary. c. Construct a box plot and describe its shape. d. Compare your answer in (c) with that from Problem 3.1
The following set of data is from a sample of n = 7:12 7 4 9 0 7 3a. Compute the mean, median, and mode.b. Compute the range, variance, standard deviation, and coefficient of variation.c. Compute the Z scores. Are there any outliers?d. Describe the shape of the data set.
The following is a set of data from a sample of n= 5: 7-5-8 7 9 a. Compute the first quartile (Q1), the third quartile (Q3), and the interquartile range. b. List the five-number summary. c. Construct a box plot and describe its shape. d. Compare your answer in (c) with that from Problem 3.4 (d) on
The file Accounting Partners contains the number of partners in a cohort of rising accounting firms with fewer than 225 employees that have been tagged as "firms to watch." The firms have the following numbers of partners: 24 32 12 13 29 30 26 17 15 21 16 23 21 19 30 14
The file Market penetration contains the market penetration value (that is, the percentage of the country population that are users) for the 15 countries that lead the world in total number of Facebook users: 50.19 25.45 4.25 18.04 31.66 49.14 39.99 28.29 37.52 28.87 37.73 46.04 52.24
Showing 63100 - 63200
of 88243
First
625
626
627
628
629
630
631
632
633
634
635
636
637
638
639
Last
Step by Step Answers
.png)
.png)
.png)
.png)
.png)
.png)
.png)
.png)
.png)
.png)
.png)
.png)
.png)
.png)
.png)
.png)
.png)
.png)
.png)
.png)
.png)
.png)
.png)
.png)
.png)
.png)
.png)
.png)
.png)
.png)
.png)
.png)
-1.png)
-2.png)
.png)
.png)

