

Question: Sales data for two years are as follows. Data are aggregated with two months of sales in each period. a. Plot the data. b. Fit
Sales data for two years are as follows. Data are aggregated with two months of sales in each “period.”
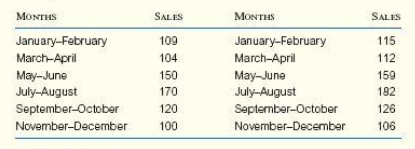
a. Plot the data.
b. Fit a simple linear regression model to the sales data.
c. In addition to the regression model, determine multiplicative seasonal index factors. A full cycle is assumed to be a full year. d. Using the results from parts (b) and (c), prepare a forecast for the next year.
MONTHS MONTHS SALES SALES January-February March-April 109 104 150 170 120 100 115 112 January-February March-April 159 182 May-June May-June July-August July-August 126 September-October November-December September-October November-December 106
Step by Step Solution
3.45 Rating (168 Votes )
There are 3 Steps involved in it
a b c t y Average from same bimonthly period Seasonal factor Deseasonalized demand t 2 t y t desea... View full answer

Get step-by-step solutions from verified subject matter experts
Document Format (1 attachment)
287-B-M-L-S-C-M (1617).docx
120 KBs Word File