

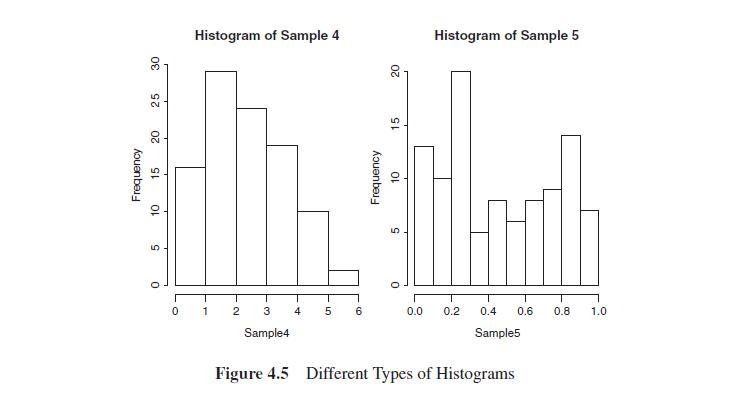
The number of intervals for the five histograms in Figure 4.5 can be seen as 11, 6,
Question:
The number of intervals for the five histograms in Figure 4.5 can be seen as 11, 6, 11, 6, and 10. How do you obtain these numbers through R?
Data from in Figure 4.5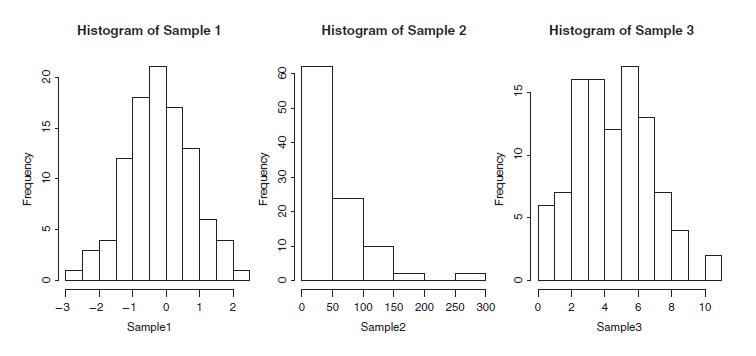
Fantastic news! We've Found the answer you've been seeking!
Step by Step Answer:
Histogram can be created using the h...View the full answer

Answered By
ISAIAH OCHIENG
I am experienced data scientist with overall 4 years of experience
0 Reviews
10+ Question Solved
Related Book For 
A Course In Statistics With R
ISBN: 9781119152729
1st Edition
Authors: Prabhanjan N. Tattar, Suresh Ramaiah, B. G. Manjunath
Question Posted:
