

Question: Some stream data have been collected from a process plant, and these are listed in Table P19.2. Assuming the minimum temperature difference between streams, (Delta
Some stream data have been collected from a process plant, and these are listed in Table P19.2. Assuming the minimum temperature difference between streams, \(\Delta T_{\min }=10^{\circ} \mathrm{C}\)
(a) calculate the data missing from Table P19.2;
(b) analyse this data to determine the minimum heat supplied from the hot utility, the minimum heat transferred to the cold utility, and the pinch temperatures;
(c) draw a schematic diagram of the heat transfer network.
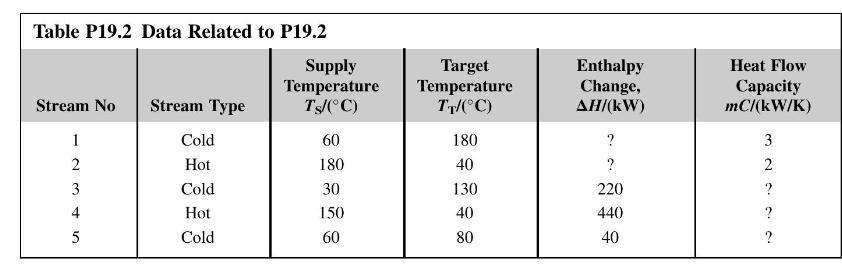
\(\left[360 \mathrm{~kW} ; 280 \mathrm{~kW} ; 2.2 \mathrm{~kW} / \mathrm{K} ; 4.0 \mathrm{~kW} / \mathrm{K} ; 2.0 \mathrm{~kW} / \mathrm{K} ; Q_{\mathrm{H}_{\text {min }}}=60 \mathrm{~kW} ; Q_{\mathrm{C}_{\text {min }}}=160 \mathrm{~kW}\right.\);
\(\left.T_{\mathrm{C}_{\text {pinch }}}=140{ }^{\circ} \mathrm{C}\right]\)
Table P19.2 Data Related to P19.2 Supply Temperature Stream No Stream Type Ts/(C) Target Temperature TT/(C) Enthalpy Change, AH/(kW) 1 Cold 60 180 ? 2341 Hot 180 40 ? Cold 30 130 220 Hot 150 40 440 5 Cold 60 80 40 Heat Flow Capacity mC/(kW/K) 32???
Step by Step Solution
3.33 Rating (138 Votes )
There are 3 Steps involved in it

Get step-by-step solutions from verified subject matter experts