

Question: Plot a graph of energy loss versus cone angle for the results of Problem 10.8. In Problem Compute the energy loss for gradual enlargements with
Plot a graph of energy loss versus cone angle for the results of Problem 10.8.
In Problem
Compute the energy loss for gradual enlargements with cone angles from 2° to 60° in the increments shown in Fig. 10.5. For each case, water at 60°F is flowing at 85 gal/min in a 2-in Schedule 40 steel pipe that enlarges to a 6-in Schedule 40 pipe.
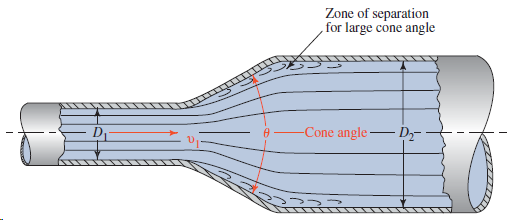
Zone of separation for large cone angle -Cone angle -
Step by Step Solution
★★★★★
3.27 Rating (159 Votes )
There are 3 Steps involved in it
1 Expert Approved Answer
Step: 1 Unlock

Energy Loss 4 tt 24 ... View full answer
Question Has Been Solved by an Expert!
Get step-by-step solutions from verified subject matter experts
Step: 2 Unlock
Step: 3 Unlock