

Question: Consider the purity data in Exercise 15-74. Use Ï = 0.8 and assume that the desired process target is 90. (a) Construct an EWMA control
(a) Construct an EWMA control chart with λ = 0.2. Does the process appear to be in control?
(b) Construct an EWMA control chart with λ = 0.5. Compare your results to part (a).
(c) Suppose that the next five observations are 90.75, 90.00, 91.15, 90.95, and 90.86. Apply the EWMAs in part (a) and (b) to these new observations. Is there any evidence that the process has shifted out of control?
Exercise 15-74
The purity of a chemical product is measured every two hours. The results of 20 consecutive measurements are as follows:
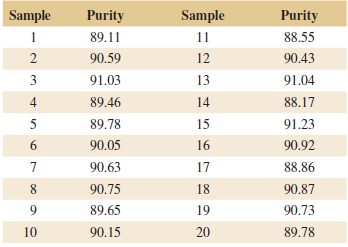
Sample Purity Sample Purity 1 89.11 11 88.55 90.59 90.43 2 12 91.03 3 13 91.04 88.17 4. 89.46 14 89.78 15 91.23 6. 90.05 16 90.92 90.63 17 88.86 8. 90.75 18 90.87 9. 89.65 19 90.73 89.78 10 90.15
Step by Step Solution
3.25 Rating (171 Votes )
There are 3 Steps involved in it
a The process appears to be ... View full answer

Get step-by-step solutions from verified subject matter experts