

Question: Consider the heart rate data in Exercise 15-83. Use μ = 70 and Ï = 3. (a) Construct an EWMA control chart with λ =
(a) Construct an EWMA control chart with λ = 0.1. Use L = 2.81. Does the process appear to be in control?
(b) Construct an EWMA control chart with λ = 0.5. Use L = 3.07. Compare your results to those in part (a).
(c) If the heart rate mean shifts to 76, approximate the ARLs for the charts in parts (a) and (b).
Exercise 15-83
Heart rate (in counts/minute) is measured every 30 minutes. The results of 20 consecutive measurements are as follows:
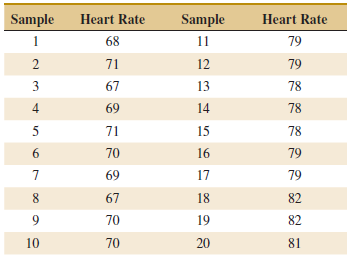
Suppose that the standard deviation of the heart rate is σ = 3 and the target value is 70.
Heart Rate Sample Sample Heart Rate 1 68 11 79 71 12 79 3 67 13 78 4. 69 14 78 71 15 78 70 16 79 69 17 79 8. 67 18 82 70 19 82 81 10 70 20
Step by Step Solution
3.42 Rating (165 Votes )
There are 3 Steps involved in it
a UCL 7193 and LCL 6807 the chart signals at observation 13 b UCL 7532 a... View full answer

Get step-by-step solutions from verified subject matter experts