

The graph in Figure 22 shows home prices in different regions of the United States. Note that
Question:
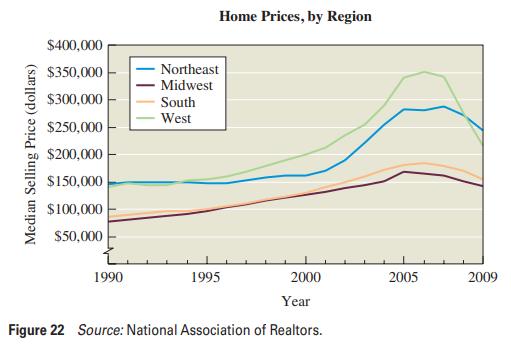
The graph in Figure 22 shows home prices in different regions of the United States. Note that the data have not been adjusted for the effects of inflation.
a. In words, describe the general trends that apply to the home price data for all regions.
b. In words, describe any differences that you notice among the different regions.
Step by Step Answer:

This question has not been answered yet.
You can Ask your question!
Related Book For 
Statistical Reasoning For Everyday Life
ISBN: 9780321904645
4th International Edition
Authors: Jeffrey Bennett, William L. Briggs, Mario F. Triola
Question Posted:
