

Question: In Exercises, view the graphs on a calculator if the given changes are made in the indicated examples of this section. In Example 2, change
In Exercises, view the graphs on a calculator if the given changes are made in the indicated examples of this section.
In Example 2, change 0.5 to 5.
Data from Example 2
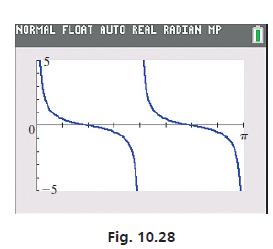
View at least two cycles of the graph of y = 0.5cot 2x on a calculator. Because the period of y = cot x is π, the period of y = cot 2x is π/2. Therefore, we choose the window settings as follows:
Xmin = 0 (x = 0 is one asymptote of the curve)
Xmax = π (the period is π/2; two periods is π)
Ymin = −5, Ymax = 5 (the range is all ; this shows enough of the curve)
We must remember to enter the function as y1 = 0.5(tan 2x)-1 , 1 because cot x= (tan x)−1. The graphing calculator view is shown in Fig. 10.28. We can view many more cycles of the curve with appropriate window settings
NORMAL FLOAT AUTO REAL RADIAN MP 0 Fig. 10.28 0
Step by Step Solution
3.36 Rating (152 Votes )
There are 3 Steps involved in it
To view the graph of y 5cot 2x we need to replace 05 w... View full answer

Get step-by-step solutions from verified subject matter experts