

Question: Make the given changes in the indicated examples, and then draw the graphs. In Example 3, change the 1 to 4 and then make the
Make the given changes in the indicated examples, and then draw the graphs.
In Example 3, change the 1 to 4 and then make the graph.
Data from Example 3
Construct the graph of x4y2 = 1 on logarithmic paper. First, we solve for y and make a table of values. Considering positive values of x and y, we have
![y = =1/1/201 x 0.5 1 2 8 [[i]samelows 1 4 1](https://dsd5zvtm8ll6.cloudfront.net/si.question.images/images/question_images/1680/0/0/0/2566422c500566801680000255879.jpg)
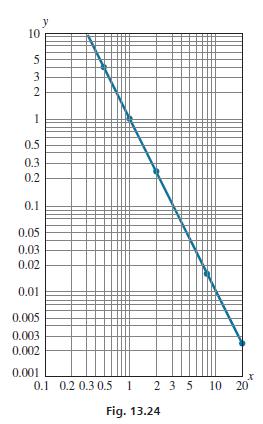
We plot these values on log-log paper on which both scales are logarithmic, as shown in Fig. 13.24. We again see that we have a straight line. Taking logarithms of both sides of the equation, we have
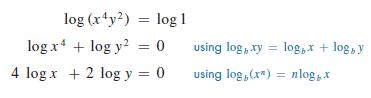
If we let u = log y and v = log x, we then have 4v + 2u = 0 or u = −2v which is the equation of a straight line, as shown in Fig. 13.24. Note, however, that not all graphs on logarithmic paper are straight lines.
y = =1/1/201 x 0.5 1 2 8 [[i]samelows 1 4 1 0.25 0.0156 0.0025 20
Step by Step Solution
3.44 Rating (154 Votes )
There are 3 Steps involved in it
We are given x 4 y 2 4 and we need to plot its graph on a logarithmic paper The ... View full answer

Get step-by-step solutions from verified subject matter experts