New Semester
Started
Get
50% OFF
Study Help!
--h --m --s
Claim Now
Question Answers
Textbooks
Find textbooks, questions and answers
Oops, something went wrong!
Change your search query and then try again
S
Books
FREE
Study Help
Expert Questions
Accounting
General Management
Mathematics
Finance
Organizational Behaviour
Law
Physics
Operating System
Management Leadership
Sociology
Programming
Marketing
Database
Computer Network
Economics
Textbooks Solutions
Accounting
Managerial Accounting
Management Leadership
Cost Accounting
Statistics
Business Law
Corporate Finance
Finance
Economics
Auditing
Tutors
Online Tutors
Find a Tutor
Hire a Tutor
Become a Tutor
AI Tutor
AI Study Planner
NEW
Sell Books
Search
Search
Sign In
Register
study help
business
business statistics a first course
Introduction To Business Statistics 7th Edition Ronald M. Weiers - Solutions
4.32 A firm has 750 production employees and wishes to select a simple random sample of 40 workers to participate in a quality-assurance training program.
4.31 Using a search engine and the key words “spy equipment,” identify some of the high-tech gadgets that companies or individuals can use in carrying out industrial espionage on other companies or individuals.
4.30 Using one or more search engines and key words of your choice, find (a) a website that reports the average life span of Saint Bernard dogs and (b) a website that advises business professionals on strategies for writing an effective memo.
4.29 Using whitepages.com, find out how many telephone listings are in your state for people with the same last name as yours. How many listings are there in your hometown for people named Smith?
4.28 Visit google.com and search message boards for postings that pertain to (a) a professional sports team and (b) a hobby or recreational activity of your choice.
4.27 Referring to each company’s online annual report, find the number of employees and net income in the most recent fiscal year for Coca-Cola, McDonald’s, and Microsoft.
4.26 Repeat Exercise 4.25, but obtain the requested descriptive statistics for Dare County, North Carolina.
4.25 Visit the U.S. Bureau of the Census (census.gov), and find the following descriptive statistics for the county where your college or university is located:a. Median household incomeb. Number of Social Security recipientsc. Per-capita retail sales
4.24 What is data mining, and how can it be useful to a business or other organization? What are some of the analytical tools it employs?Note: Exercises 4.25–4.31 require a computer and access to the Internet. Web addresses were accurate at this writing. If a site address is no longer applicable,
4.23 What is the Encyclopedia of Associations, and how can this publication be useful to the business researcher?
4.22 Briefly, what kinds of information does the U.S.Department of Commerce provide in its Census of Population? In its Census of Housing?
4.21 What kinds of external secondary data are readily available online?
4.20 Besides accounting and financial information, what are some of the other sources of internal secondary data?
4.19 What are secondary data? Differentiate between internal and external secondary data.
4.18 In doing “observational studies” while driving through suburban neighborhoods during the summer months, home burglars look for potential victims who are away on vacation. What kinds of observation indicators would tend to tell the burglars that a family is likely away on vacation? What are
4.17 When traveling, some motorists assume that a restaurant has good food and reasonable prices if there are a lot of trucks parked outside. What other observed characteristics of a restaurant might a traveler use in deciding whether to stop and eat?
4.13 A company has constructed two prototypes of a new personal digital assistant (PDA) and would like to find out which one of the two looks easier to use. Of the three types of surveys discussed in this section, which one would the company not wish to employ?
4.12 In order to increase the response rate to mail questionnaires, researchers sometimes include a dollar bill or other monetary incentive to reward the respondent for his or her cooperation. Could there be occasions where a relatively large reward—e.g., the inclusion of a $20 bill with a short
4.11 A research firm finds that only 33% of those who reported buying Kellogg’s Frosted Flakes had actually purchased the product during the period monitored.What type of survey research error does this represent?
4.10 Explain what is meant by sampling error, response error, and nonresponse error in survey research.
4.9 How does a compiled mailing list differ from a response mailing list?
4.8 What is random-digit dialing and why is it used?
4.7 Comment on the appropriateness of the question,“Have you ever broken the law and endangered the lives of others by running a red light?”
4.6 Provide an example of a survey question that would tend to exceed the vocabulary level of the typical adult.
4.5 What are the major approaches to carrying out survey research?
4.4 Bertram Pearlbinder, owner of an apartment building near the campus of Hightower University, is considering the possibility of installing a large-screen color television in the building’s recreation room. For each of the following, indicate whether the associated data are primary or
4.3 A pharmaceutical firm’s annual report states that company sales of over-the-counter medicines increased by 48.1%.a. To the firm itself, would this information be primary data or secondary data?b. To a competitor, what type of information would this represent?
4.2 A published article reports that 60% of U.S. households have cable television. The president of an electronics firm clips the item from the paper and files it under“Cable TV data.” Would this material be considered primary data or secondary data?
4.1 What is the difference between primary data and secondary data? Between internal secondary data and external secondary data?
2.1 Understand that probability samples are necessary to estimate the amount of sampling error.
2.1 Differentiate between sampling error and nonsampling error.
2.1 Differentiate between the probability and nonprobability approaches to sampling, and understand when each approach is appropriate.
2.1 Explain why a sample is generally more practical than a census.
2.1 Understand the relevance of the data warehouse and data mining.
2.1 Differentiate between internal and external secondary data, and identify sources for each.
2.1 Describe the experimentation and observational approaches to research.
2.1 Discuss the major sources of error in survey research.
2.1 Describe how survey research is conducted.
2.1 Explain the difference between primary and secondary data.
2.1 Describe the types of business research studies and their purposes.
2.1 Based on your results and responses to the previous questions, does the screening test appear to be potentially useful as one of the factors in helping Baldwin predict whether a given applicant will end up defaulting on his or her computer loan?
2.1 Construct adjacent dotplots (use box plots if the dotplot feature is not available on your computer statistical package) and visually compare the screening test scores of students who did not default on their computer loan to the scores of those who defaulted.Does the distribution of screening
2.1 In the descriptive statistics of the screening test scores for the students who did not default, identify the value of the third quartile and interpret its meaning. If this numerical value had been established as a cutoff for receiving a computer loan, what percentage of those who repaid would
2.1 Generate appropriate descriptive statistics of the screening test scores for those who did not default on their computer loan. Be sure to include the mean and the third quartile. Do the same for those who did default, then compare the results. Is the mean score on the screening test higher for
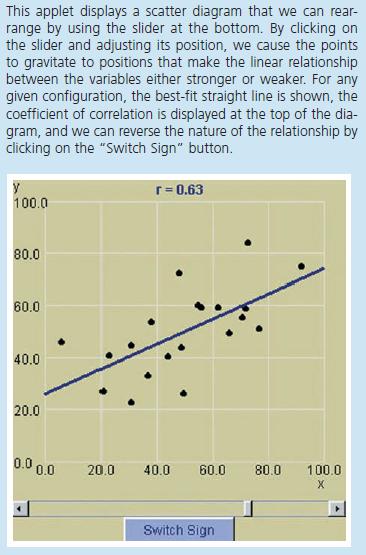
2.5 With the slider positioned at the far left, gradually move it to the far right. Describe the changes taking place in the best-fit line and the pattern of points along the way. This applet displays a scatter diagram that we can rear- range by using the slider at the bottom. By clicking on the
2.4 Click the “Switch Sign” button. Describe how the bestfit line and its relationship to the pattern of points have changed. This applet displays a scatter diagram that we can rear- range by using the slider at the bottom. By clicking on the slider and adjusting its position, we cause the
2.3 Adjust the slider so that the coefficient of correlation is as close as possible to 10.60. Describe how the best-fit line and its relationship to the pattern of points have changed. This applet displays a scatter diagram that we can rear- range by using the slider at the bottom. By clicking on
2.2 Click on the slider and adjust it so that the coefficient of correlation is 11.0. Describe the best-fit line and its relationship to the pattern of points. This applet displays a scatter diagram that we can rear- range by using the slider at the bottom. By clicking on the slider and adjusting
2.1 Click on the slider and adjust it so that the best-fit straight line is as close as possible to horizontal. What is the value of the coefficient of correlation? This applet displays a scatter diagram that we can rear- range by using the slider at the bottom. By clicking on the slider and
1.4 Suppose the ninth car were a jet-powered supersonic vehicle and traveled through the neighborhood at 1000 mph.Although such a speed lies far beyond the scale in the applet, what would be the value of the median? What would be the approximate value for the mean? Which of these two sample
1.3 By adjusting the speed of the ninth car, identify the highest and lowest possible values for the median speed for the nine cars in the applet. The dots in this applet can be viewed as showing the speeds of a sample of nine cars being driven through a residential area. Eight of the values are
1.2 Click on the rightmost green dot and drag it so that the speed of the ninth car increases from 40 mph to 100 mph.What effect has this had on the value of the median? The dots in this applet can be viewed as showing the speeds of a sample of nine cars being driven through a residential area.
1.1 Click on the rightmost green dot and drag it so that the speed of the ninth car is 40 mph. What is the value for the median? The dots in this applet can be viewed as showing the speeds of a sample of nine cars being driven through a residential area. Eight of the values are fixed, but we can
4. Determine the coefficient of correlation between variable 29 (number of persons in the household) and variable 30 (age). What percentage of the variation in household size is explained by respondent age?When we last visited the Thorndikes, one of the company’s engineers had just developed a
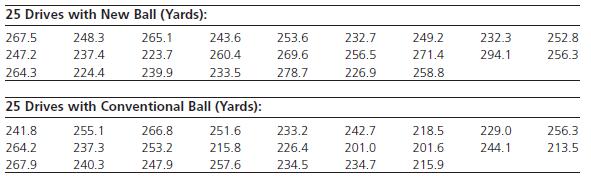
3. Use their respective coefficients of variation to compare the relative amount of dispersion in variable 29 (number of persons in the household) with that of variable 30(res pondent’s age).When we last visited the Thorndikes, one of the company’s engineers had just developed a new golf ball.
2. Based on the results for question 1, which attributes seem to be the most important and the least important in respondents’ choice of a shopping area?When we last visited the Thorndikes, one of the company’s engineers had just developed a new golf ball. According to the engineer, the new
1. Perform the following operations for variables 18–25:a. Obtain descriptive statistics, including the mean and median.b. Generate a box-and-whisker plot for the variable.Does the distribution appear to be skewed? If so, is the skewness positive or negative?When we last visited the Thorndikes,
3.69 During a five-year period, the Federal Aviation Administration took administrative actions (letters of correction or warning notices) and levied fines against U.S. airline companies for various safety-related reasons.For each airline involved, data file XR03069 lists the number of
3.68 Data for a sample of college players eligible to enter the National Football League include weight (pounds) and time (seconds) required to sprint 40 yards. Using the data listed in file XR03068, and with weight as the x(indepen dent) variable and time as the y (dependent)variable, generate a
3.67 During 2005, 1,186,000 college-bound high school seniors took the ACT college admission test. The average score on the mathematics component was 20.7, with a standard deviation of 5.0. We are assuming that the math scores in data file XR03067 could have been the math scores for a sample of 400
3.66 Bride’s magazine reports the cost of the average honeymoon as $5111. Assume that their findings could have been based on the honeymoon expenditures of a sample consisting of 300 couples whose costs are listed in data file XR03066. Source: msnbc.msn.com, June 26, 2009.a. Confirm the mean and
3.65 According to the Energy Information Administration, the average U.S. household spends $1196 per year for electricity. Assume that this finding could have been based on the electricity expenditures reported by 250 households, with the data in file XR03065. Source: eia.doe.gov, June 26, 2009.a.
3.64 For the sample data presented in the dotplot of Exercise 3.63, construct a frequency distribution in which the classes are 10–under 20, 20–under 30, and 30–under 40. If this frequency distribution were all that we knew about the underlying data, what approximate values would be estimated
3.63 The following dotplot describes the lengths, in pages, of a sample consisting of 20 reports generated by a consulting firm during the past 3 months. Based on the dotplot, what are the values for the median and the first and third quartiles? 10 20 30 40 PAGES 50
3.62 Using the frequency distribution in Exercise 3.53, determine the approximate mean and standard deviation for the underlying data.
3.61 Use the coefficient of variation to compare the variability of the data in Exercise 3.57 with the variability of the data in Exercise 3.60.
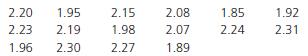
3.60 A law enforcement agency, administering breathalyzer tests to a sample of drivers stopped at a New Year’s Eve roadblock, measured the following blood alcohol levels for the 25 drivers who were stopped:a. Calculate the mean and standard deviation for this sample.b. Use Chebyshev’s theorem
3.59 A testing firm has measured the power consumption of 40 dorm-size microwave ovens selected at random from the manufacturer’s production line. Given the following box-and-whisker plot, determine the approximate values for the median, the first and third quartiles, and the range.Does the
3.58 The accompanying box-and-whisker plot represents the number of gallons of water used by 80 households over a 1-day period. Determine the approximate values for the median, the first and third quartiles, and the range. Does the distribution appear to be skewed? If so, is it positively skewed or
3.57 A quality control supervisor has taken a sample of 16 bolts from the output of a thread-cutting machine and tested their tensile strengths. The results, in tons of force required for breakage, are as follows:a. Determine the mean, median, range, and midrange.b. Calculate the mean absolute
3.56 For a sample of five different years from the period 1960 through 2007, it is found that U.S. work stoppages involving at least 1000 workers occurred 268 times in one of these years, with 424, 235, 145, and 44 work stoppages in the other four. Source: Bureau of the Census, Statistical Abstract
3.55 A grocery store owner has found that a sample of customers purchased an average of 3.0 pounds of luncheon meats in the past week, with a sample standard deviation of 0.5 lb.a. If the store’s meat scale is off by 0.1 lb (e.g., a purchase listed as 1 lb actually weighs 1.1 lb), what will be
3.54 The cafeteria manager at a manufacturing plant has kept track of the number of cups of coffee purchased during each of the past 90 working days.a. Using the following descriptive statistics, construct a box-and-whisker plot for the data. Does the distribution appear to be symmetrical? If not,
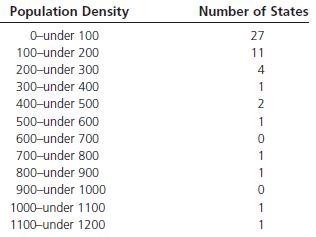
3.53 The frequency distribution for population density(persons per square mile) for the 50 U.S. states is as follows:Does this distribution appear to be symmetrical? If not, is it skewed positively or negatively? Population Density 0-under 100 100-under 200 Number of States 27 11 200-under 300
3.52 Natural History magazine has published a listing of the maximum speeds (in mph) for a wide variety of animals, including those shown in the table.a. Determine the mean and the median for these data.b. Is there a mode? If so, what is its numerical value? Cheetah 70 Grizzly bear 30 Pronghorn
3.51 According to Honda Motor Co., Inc., the exchange rate (yen per U.S. dollar) from 1998 through 2005 was 123, 128, 112, 111, 125, 122, 113, and 108. Determine the mean and median for these data. Is there a mode?If so, what is its numerical value? Source: Honda Motor Co., Ltd., 2005 Annual Report.
3.50 The 2007 top-grossing feature film was Spiderman 3, a product that brought in $336.5 million at the box office. The gross receipts for this and the rest of the top-20 feature films of that year are shown below. Determine the mean and median for these data. Is there a mode? If so, what is its
3.49 A dental supplies distributor ships a customer 50 boxes of product A, 30 boxes of B, 60 boxes of C, and 20 boxes of D. The unit shipping costs (dollars per box) for the four products are $5, $2, $4, and $10, respectively.What is the weighted mean for shipping cost per unit?
3.48 The first seven customers of the day at a small donut shop have checks of $1.25, $2.36, $2.50, $2.15,$4.55, $1.10, and $0.95, respectively. Based on the number of customers served each day, the manager of the shop claims that the shop needs an average check of$1.75 per person to stay
3.47 A report on the average price of a sample of brandname prescription drugs with their generic equivalents has found the generics to be considerably cheaper. The drugs and the average prices for their brand-name versus generic versions are listed in data file XR03047. Generate a scatter diagram
3.46 The U.S. National Center for Health Statistics has compiled data on death rates (deaths per 100,000 people) from heart disease and cancer for the 50 states.The states and their respective death rates from these two diseases are provided in data file XR03046. Generate a scatter diagram with
3.45 In the U.S. News & World Report top-50 U.S.law schools in Exercise 2.67, the listing for each school included two rating scores: one from academic evaluators and another from lawyer/judge evaluators. Using the data in file XR02067, generate a scatter diagram with axes of your choice, fit a
3.44 In Exercise 3.14, two of the variables examined by the personnel director were age and number of absences during the past year. Using the data in file XR03014, generate a scatter diagram (with y 5 number of absences and x 5 age), fit a linear equation to the data, then determine and interpret
3.43 For a set of data, r2 is 0.64 and the variables x and y are inversely related. What is the numerical value of r?( DATA SET ) Note: Exercises 3.44–3.47 require a computer and statistical software.
3.42 What is the coefficient of determination and what does it tell us about the relationship between two variables?
3.41 Eighty packages have been randomly selected from a frozen food warehouse, and the age (in weeks) of each package is identified. Given the frequency distribution shown, determine the approximate mean and standard deviation for the ages of the packages in the warehouse inventory.E X E R C I S E
3.40 A sample consisting of 100 employees has been given a manual-dexterity test. Given the accompanying frequency distribution, determine the approximate mean and standard deviation for these data.
3.39 Using the data in Exercise 3.5, construct a frequency distribution.a. Determine the approximate values of the mean and standard deviation.b. Compare the approximate values from part (a) with the actual values.c. Construct a frequency distribution with twice as many classes as before, then
3.38 Exercise 3.25 described a study in which e-commerce researchers visited walmart.com on multiple occasions during the holiday shopping season and measured the time (in seconds) it took for the site to come up on the computer screen. Data file XR03025 contains results that we assumed could have
3.37 In Exercise 3.14, the personnel director has collected data describing 100 employees, with one of the variables being the number of absences during the past year. Using data file XR03014, describe the variable, number of absences.a. Construct and interpret the box-and-whisker plot for the
3.36 A resort catering to golfers has reported the average income of golfer households to be $95,000. Assume that this average had been based on the 100 incomes in file XR03036. Source: golfwashington.com, June 23, 2009.a. Construct and interpret the box-and-whisker plot for the data.b. Standardize
3.35 A sample of 20 customers from Barnsboro National Bank reveals an average savings account balance of$315, with a standard deviation of $87. A sample of 25 customers from Wellington Savings and Loan reveals an average savings account balance of $8350, with a standard deviation of $1800. Which of
3.34 For data set A, the mean is $1235, with a standard deviation of $140. For data set B, the mean is 15.7 inches, with a standard deviation of 1.87 inches.Which of these two data sets has the greater relative dispersion?
3.33 For college-bound high school seniors from a certain midwestern city, math scores on the Scholastic Aptitude Test (SAT) averaged 480, with a standard deviation of 100. Assume that the distribution of math scores is bell shaped and symmetrical.a. What is the approximate percentage of scores
3.32 The manufacturer of an extended-life lightbulb claims the bulb has an average life of 12,000 hours, with a standard deviation of 500 hours. If the distribution is bell shaped and symmetrical, what is the approximate percentage of these bulbs that will lasta. between 11,000 and 13,000 hours?b.
3.31 Standardize the data in Exercise 3.21, then identify the percentage of observations that fall within k 5 2.0 standard deviation units from the mean. Do the results support Chebyshev’s theorem?
3.30 For the data in Exercise 3.20, determine the percentage of observations that fall within k 5 1.5 standard deviation units from the mean. Do the results support Chebyshev’s theorem?
3.29 According to Chebyshev’s theorem, what per centage of observations should falla. within 2.5 standard deviations of the mean?b. within 3.0 standard deviations of the mean?c. within 5.0 standard deviations of the mean? 35 36 37 38 39 40 41 42 43 44 DEFECTS
3.28 A manufacturing firm has collected information on the number of defects produced each day for the past 50 days. The data have been described by the accompanying Minitab box-and-whisker plot.a. What is the approximate value of the median? The first and third quartiles?b. What do the asterisks
3.27 Data file XR02028 shows the depths (in meters) that 80 water-resistant watches were able to withstand just before leakage. For the watches in this sample, determine and interpret the following:a. The mean, median, range, and midrange.b. The mean absolute deviation.c. The standard deviation and
Showing 1500 - 1600
of 2344
First
9
10
11
12
13
14
15
16
17
18
19
20
21
22
23
Last
Step by Step Answers