New Semester
Started
Get
50% OFF
Study Help!
--h --m --s
Claim Now
Question Answers
Textbooks
Find textbooks, questions and answers
Oops, something went wrong!
Change your search query and then try again
S
Books
FREE
Study Help
Expert Questions
Accounting
General Management
Mathematics
Finance
Organizational Behaviour
Law
Physics
Operating System
Management Leadership
Sociology
Programming
Marketing
Database
Computer Network
Economics
Textbooks Solutions
Accounting
Managerial Accounting
Management Leadership
Cost Accounting
Statistics
Business Law
Corporate Finance
Finance
Economics
Auditing
Tutors
Online Tutors
Find a Tutor
Hire a Tutor
Become a Tutor
AI Tutor
AI Study Planner
NEW
Sell Books
Search
Search
Sign In
Register
study help
business
business statistics a first course
Introduction To Business Statistics 7th Edition Ronald M. Weiers - Solutions
For the data of Exercise 18.13, fit an exponentially smoothed curve with smoothing constant 5 0.4; with smoothing constant 5 0.7. Which constant provides more “smoothing” and why? Which curve is quicker to “catch up” whenever the original series changes direction and why?
For the data of Exercise 18.11, fit an exponentially smoothed curve with smoothing constant 5 0.4; with smoothing constant 5 0.7. Which constant provides more“smoothing” and why? Which curve is quicker to “catch up” whenever the original series changes direction and why?
The following data describe U.S. manufacturers’shipments of general aviation jet aircraft from 1989 through 2008.a. Construct a graph of the time series. Does the overall trend appear to be upward or downward?b. Determine the three-year and five-year centered moving average curves and superimpose
For the data of Exercise 18.13:a. Obtain the centered moving average for N 5 4; for N 5 12.b. When N 5 12 months, the centered moving average is relatively smooth compared to N 5 4. Aside from the fact that it includes a greater number of months at a time, is there any other reason why the moving
The following data describe the monthly volume for an urban courier service. Data are in thousands of pieces handled.a. Construct a graph of the time series. Does the overall trend appear to be upward or downward?b. Determine the three-month and five-month centered moving average curves and
For the data of Exercise 18.11:a. Obtain the centered moving average for N 5 4; for N 5 12.b. When N 5 12 months, the centered moving average is relatively smooth compared to when N 5 4. Aside from the fact that it includes a greater number of months at a time, is there any other reason why the
According to the U.S. Energy Information Administration, a heating degree-day is a relative measurement of outdoor temperature that indicates how far the average daily temperature is below 65° Fahrenheit. The higher the number of heating degree-days, the greater the national demand for heating
For the data in Exercise 18.9, determine the centered moving average for N 5 2; for N 5 4.
The following data show residential and commercial natural gas consumption (quadrillion Btu)from 1992 through 2007.a. Construct a graph of the time series, then superimpose a three-year centered moving average over the original series.b. Superimpose a five-year centered moving average over the
From 2000 through 2007, the value of U.S. exports to Mexico was as shown below. Data are in billions of dollars.a. Fit a linear trend equation to the time series. Using this equation, determine the trend estimate for 2015.b. Fit a quadratic equation to the time series, then use the equation to
U.S. cellular phone subscribership has been reported as shown here for the 1996–2007 period.a. Fit a linear trend equation to the time series. Using this equation, determine the trend estimate for 2013.b. Fit a quadratic equation to the time series, then use the equation to determine the trend
Fit a linear trend equation to these data showing the value of shipments of food products in billions of dollars.What is the trend estimate for 2015? Year: 2004 2005 2006 2007 Shipments: $512.3 $532.4 $537.8 $573.5
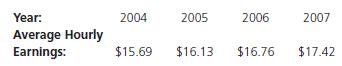
Fit a linear trend equation to the following data describing average hourly earnings of U.S. production workers. What is the trend estimate for 2013? Year: 2004 2005 2006 2007 Average Hourly Earnings: $15.69 $16.13 $16.76 $17.42
The trend equation ˆ y 5 1200 1 35x has been fitted to a time series for industry worker days lost due to job-related injuries. If x 5 1 for 1995, estimate the number of worker days lost during 2012.
The estimated trend value of community water consumption is 400,000 gallons for a given month.Assuming that the cyclical component is 120% of normal, with the seasonal and irregular components 70% and 110% of normal, respectively, use the multiplicative time series model in determining the quantity
For each of the following, indicate which time series component is represented. Explain your reasoning.a. The proprietor of a movie theater finds Saturday is the most popular day of the week for movie attendance.b. Political advertising in the United States peaks every 4 years.c. Sales of a
What are the four components of a time series, and to what kind of variation in the series does each refer?
Based on your analysis in Case Question 2, and even considering the results from a complete regression that uses all of the possible predictive variables identified in Case Question 1, does there seem to be very much variation in sales price that is not explained by the independent variables
Provide further assistance to Sam Easton by carrying out and interpreting the results of an appropriate stepwise regression designed to indicate which of the predictive variables mentioned in Case Question 1 are most important in determining the sales price of a house. (Note to Minitab users: For
As a first step in helping Sam Easton better understand how the sales price of a residential property is determined, construct a correlation matrix for the variables PRICE, SQFEET, BEDROOMS, AGE, DALLAS, and EASTON. Examine the matrix and advise Mr. Easton as to which variable seems to be the most
Based on your analysis in Case Question 2, and even considering the results from a complete regression that uses all of the possible predictive variables, does there seem to be very much variation in the first-year MBA grade point average that is not explained by the independent variables provided
Because the committee is very interested in using predicted first-year MBA grade point average in measuring the quality of applicants to its program, assist the members further by carrying out and interpreting the results of an appropriate stepwise regression of the data. (Note to Minitab users:
The committee wishes to use first-year MBA grade point average as its measure of the quality of a student.As a first step in assisting committee members, construct a correlation matrix and briefly discuss the information it contains that could be of help to the committee members. If they were to
Repeat step 2, but this time perform a stepwise regression analysis. Minitab and Excel users should refer to the following notes. Identify the variables that were introduced and interpret the printout. What percentage of the variation in stock prices is explained by the reduced set of predictor
Using y 5 stock price (variable 8) as the dependent variable, carry out a conventional multiple regression analysis using variables 2–7, 9, and 11–16. Excel users, see note 1, which follows. Examine the partial regression coefficients to see whether their signs match the signs of the
Generate a correlations matrix that includes variables 2–9 and 11–16. (Variable 10 would be meaningless here because its values are 1–7 for the 7 company categories.)Do the correlations “make sense” in terms of which correlations are positive and which are negative?
As indicated in the chapter-opening vignette, the National Football League quarterback passer rating is somewhat of a mystery to most observers. Data file XR17073 includes the passer rating for 32 NFL quarterbacks during the 2008 season, along with these ten performance measurements for each
Repeat parts (b)–(d) of Exercise 17.71, with Test 1 as the dependent variable, and Test 2, Test 3, Test 4, and Final Exam as the independent variables.
The students in a training program have taken four tests along with a final exam, with the scores shown in the table. The data are also in file XR17071.a. Construct the correlation matrix for these variables.Does it appear that multicollinearity could be a problem if all of the independent
Given the situation and variables described in Exercise 17.66 and data file XR17066, use y 5 percent of sales quota in performing a stepwise regression using the other variables as predictors. Interpret the results, including a commentary on which variables seem to be of greater importance in
Data file XR17069 lists a variety of information for a selection of aircraft. The variables and their units are: operating cost (dollars per hour), number of seats, speed (mph), flight range (miles), and fuel consumption(gallons per hour). Considering operating cost per hour as the dependent
The Dow Jones Global Indexes describe over 3000 companies worldwide that represent more than 80% of the equity capital in the world’s stock markets. Data file XR17068 shows the quarterly indexes for the world as a whole, and indexes for the United States, the Americas, Europe, and the
For the loan delinquency data in Exercise 17.64 and listed in file XR17064, fit a multiplicative model and use it to estimate the delinquency rate for all insured commercial bank loans when the delinquency rates for credit cards and residential loans are 4.0% and 2.0%, respectively.
The sales director for an industrial supplies firm has collected information describing the performance and personal characteristics of 80 members of her sales force. The data in file XR17066 include the percent of sales quota the salesperson achieved last year, age, number of years with the firm,
The production engineer for the manufacturing plant in Exercise 17.61 has just included another variable:the worker’s gender, coded as 1 5 female and 0 5 male. File XR17065 contains the expanded set of data. With y 5 productivity (units/hour), x1 5 number of units in the backlog area, and x2 5
For loans at insured commercial banks, the Federal Financial Institutions Examination Council has reported the percentage of various kinds of loans that were at least 30 days in delinquency during each of the years shown in the table. The data are also listed in file XR17064. For y 5 percent of all
The data in file XR17063 include the wind chill index (how cold it “feels”) at different combinations of outside temperature (degrees Fahrenheit) and wind speed(miles per hour). For y 5 wind chill index, x1 5 actual outside temperature, and x2 5 wind speed, fit a firstorder polynomial model to
The data in the table show the number of years it took for selected technological innovations to spread to 25% of the U.S. population. The data are also in file XR17062. For y 5 years to spread and x 5 years past 1800 (e.g., the code for 1975 is 175), generate a scatter diagram and apply an
Each workstation in the final assembly area of a large manufacturing facility has a “backlog” area to hold units that are to be processed. A production engineer believes there could be a relationship between the number of units in the backlog area and the productivity of the worker.
For 1995 through the first half of 2009, PricewaterhouseCoopers and the National Venture Capital Association reported quarterly venture capital investments (trillions of dollars) and the number of investment deals as shown in data file XR17060. Generate a scatter diagram with the number of deals as
J.K. Rowling’s popular Harry Potter books have tended to become thicker with each new edition. The publication year and page count for U.S. editions for the first seven books were as shown on the next page.The data are also in file XR17059. Using year codes so that x 5 1 corresponds to 1998, the
As reported by the Recording Industry Association of America, the percentage of recorded music dollar sales in CD format was as shown here for the years 2000 through 2007. The data are also in file XR17058.Using x 5 1 through 8 to represent years 2000–2007, fit a second-order polynomial model to
Using the data file for Exercise 17.55:a. Apply stepwise regression with the rating by board member 9 as the dependent variable and the ratings by the other 8 members as the set of independent variables from which to select, then interpret the results.b. Including only the independent variables
Using the data file for Exercise 17.55:a. Apply stepwise regression with the rating by board member 1 as the dependent variable and the ratings by the other 8 members as the set of independent variables from which to select. Interpret the results.b. Using only the independent variables introduced
An officer training program has 9 board members who provide ratings for the candidates. The high and low scores are dropped before the overall rating is computed.For a sample of 28 persons from the most recent class of candidates, the overall ratings and ratings by the individual board members are
For the situation and data described in Exercise 17.17, perform conventional multiple regression and stepwise regression analyses on the data, then compare the results of the two approaches. Use total operating revenue as the dependent variable and number of aircraft, number of employees, and
For the situation, data, and variables described in Exercise 17.15, perform conventional multiple regression and stepwise regression analyses on the data, then compare the results of the two approaches. The data are in file XR17015.
For the situation, data, and variables described in Exercise 17.16, perform conventional multiple regression and stepwise regression analyses on the data, then compare the results of the two approaches. The data are in file XR17016.
For the data in Exercise 17.45, and using total nonrenewable energy production as the dependent variable, perform conventional multiple regression and stepwise regression analyses on the data, then compare the results of the two approaches. The data are in file XR17045.
For the data in Exercise 17.44, and using Sunday circulation as the dependent variable, perform conventional multiple regression and stepwise regression analyses on the data, then compare the results of the two approaches. The data are in file XR17044.
The following Minitab printout is for a stepwise regression with 10 independent variables and 50 observations:a. List the order in which the independent variables have been introduced.b. What is the multiple regression equation after two independent variables have been introduced?c. As of step 3,
The two largest values in a correlation matrix are the 0.850 correlation between y and x4, and the 0.790 correlation between y and x9. During a stepwise regression analysis, x4 is the first independent variable brought into the equation. Will x9 necessarily be next? If not, why not?
In general, on what basis are independent variables selected for entry into the equation during stepwise regression?
What is stepwise regression, and when is it desirable to make use of this multiple regression technique?
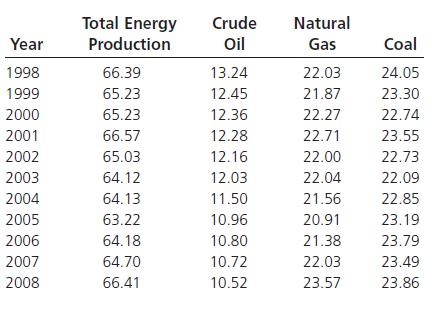
For the years 1998–2008, production in the U.S. energy sector included the quantities shown here.The variables represent total energy production as well as energy production from nonrenewable fossil fuels. The units are in quadrillion Btu and the data are also in file XR17045. For these data, and
Circulation (millions) for Sunday newspapers versus morning and evening daily papers for 1999–2007 are shown here. The data are also in file XR17044. With Sunday circulation as the dependent variable, generate the correlation matrix for the independent variables and comment on the possible
For the situation and variables in Exercise 17.17, use data file XR17017 and generate a correlation matrix for these independent variables: number of aircraft, number of employees, and number of aircraft departures.Examine the correlation matrix and comment on the possible presence of
For the situation and variables in Exercise 17.16, use data file XR17016 and generate a correlation matrix for the independent variables. Examine the correlation matrix and comment on the possible presence of multicollinearity.
Four predictor variables are being considered for use in a linear regression model. Given the accompanying correlation matrix, does it appear that multicollinearity could be a problem? E F G H 1 x1 x2 x3 x4 2345 x1 1.000 x2 0.483 1.000 x3 0.952 0.516 1.000 x4 -0.164 -0.202 -0.113 1.000
A linear regression analysis was performed using x1 as a predictor variable. The p-value associated with the regression coefficient for x1 was 0.02, and the sign of the coefficient was negative. Another analysis was performed, this time using both x1 and x2 as predictor variables. In the second
In linear regression models, for what types of uses or applications would multicollinearity tend to be a problem?Are there any applications or uses for which multicollinearity would not be a problem?
One of the indicators that multicollinearity is present is when a variable that is known to be an important predictor ends up having a partial regression coefficient that is not significant. What are some of the other signals for the presence of multicollinearity?
What is a correlation matrix, and what role does it play in multiple regression?
For the situation and variables in Exercise 17.16, fit a multiplicative model and use it to estimate the rental revenue for a company with 80,000 cars in service and 2500 rental locations. The underlying data are in file XR17016.
For the situation and variables in Exercise 17.17, fit a multiplicative model and use it to estimate the total operating revenue for an airline with 2000 employees and 10,000 departures. The underlying data are in file XR17017.
For the situation and variables in Exercise 17.8, fit an exponential model and use it to estimate the world record time for the 100-meter dash in the year 2014. The underlying data are in file XR17008.
For the situation and variables in Exercise 17.7, fit an exponential model and use it to estimate the average room rate for a market in which the average occupancy rate is 70%. The underlying data are in file XR17007.
Following data transformation, regression analysis results in the estimation equation log yˆ 5 3.15 1 0.473 log x1 1 0.354 log x2. Trans form this equation to the equivalent multiplicative model with estimation equation yˆ 5 b0 x1 b1x2 b2 . (The base of the logarithms is 10.)( DATA SET ) Note:
Following data transformation, regression analysis results in the estimation equation log yˆ 5 20.179 10.140x. Transform this equation to the equivalent exponential model with estimation equation yˆ 5 b0b1 x. (The base of the logarithms is 10.)
For a small sample of suburban homes recently sold, the selling price ($), living space (square feet), and suburban area (Sunny Haven, Easy Acres, or Rolling Hills) have been recorded. Given the data shown here, determine the linear regression equation for estimating selling price based on the
An efficiency expert has studied 12 employees who perform similar assembly tasks, recording productivity(units per hour), number of years of experience, and which one of three popular assembly methods the individual has chosen to use in performing the task. Given the data shown here, determine the
A researcher has observed 50 automatic teller machine (ATM) users outside the gift shop of a museum, and the data are in file XR17028. With y 5 amount withdrawn(dollars), x1 5 time required for the transaction(seconds), and x2 5 gender (1 5 female, 0 5 male), determine the linear regression
In a PC World comparison of computer hard drives, data describing the drives included the following variables: price (dollars), disk capacity (gigabytes), and rotational speed (RPM). The data are in file XR17027. With y 5 price, x1 5 disk capacity, and x2 5 rotational speed(coded as 1 5 7200 RPM
The dean of a law school has developed a regression equation for estimating the starting salary (thousands of dollars) of a new graduate on the basis of two independent variables: x1 5 the score achieved on the Law School Admission Test (LSAT) at the time of application, and x2 5 whether the new
The manager of an ice cream store has developed a regression equation for estimating the number of customers on the basis of two independent variables: x1 5 the high temperature (degrees Fahrenheit) for the day, and x2 5 whether the day is during the weekend (coded as 1) or is a weekday (coded as
Repeat Exercise 17.23, but for clients whose risk levels have been specified as low, medium, high, or very high.
Data to be used in a linear regression analysis involving clients of an investment counselor include information regarding the risk level each client has specified:low, medium, or high. Determine the number of qualitative independent variables that will be required to represent this information and
Repeat Exercise 17.21, but assume that more information is available regarding the specific type of credit card that was used for the purchase, that is, Visa, MasterCard, or other.
For a sample of 100 recent credit-card customers of a company’s on-line store, the following data are available: the dollar amount of merchandise ordered during the visit, how much time (minutes) the customer spent at the site during the purchase visit, and whether the customer used a Visa credit
Repeat Exercise 17.19, but using a second-order model with interaction. Interpreting the R2 value, to what extent has inclusion of the squared terms improved the model’s explanatory power?
For the Car and Driver information described in Exercise 17.9, it would seem reasonable that the number of seconds required to accelerate to 60 mph would depend on both a car’s weight and its horsepower.Further, it would be logical to assume that horsepower and weight might interact. Using data
Repeat Exercise 17.17, using the data in file XR17017, but with y 5 total operating revenue (millions of dollars), x1 5 number of aircraft, and x2 5 number of employees.
The Air Transport Association has reported the following kinds of information describing 23 individual U.S. airlines: total operating revenue, number of aircraft, number of employees, and number of aircraft departures.Using data file XR17017, with y 5 total operating revenue(millions of dollars),
Auto Rental News has reported U.S. operations data for 15 top rental-car companies. Using data file XR17016, with y 5 rental revenue (millions of dollars), x1 5 thousands of cars in service, and x2 5 number of rental locations: Source: Wall Street Journal Almanac 1999, p. 649.a. Fit a first-order
The personnel director of the communications firm in Exercise 17.5 has just provided another variable describing the company’s technical sales representatives:their scores on a sales aptitude test they were recently given. Using data file XR17015, with y 5 average dollar sales per call, x1 5
The regression model yˆ 5 200 1 5x1 2 2x2 has been fitted to a set of data. If x2 5 10, what will be the effect on yˆ if x1 increases by 1 unit? Will your answer change if x2 5 20? Given the preceding, comment on whether interaction appears to exist between x1 and x2.( DATA SET ) Note: Exercises
In Exercise 17.12, suppose the researcher wishes to use one of the models in this section, but is uncertain as to whether y might be nonlinearly related to x1 and/or x2.Also, the researcher doesn’t have any idea as to whether interaction might exist between x1 and x2. Of the models in this
A researcher suspects that the dependent variable y is linearly related to both x1 and x2, but believes there is little or no interaction between the two predictor variables.Of the models in this section, which one would likely be most suitable for this situation?
For the 20 top-grossing U.S. films of the 1990s, data have been reported for y foreign gross ticket sales and x 5 domestic gross ticket sales, both in millions of dollars. The printout here shows the results for a secondorder polynomial model fitted to the data. What amount of foreign gross ticket
Repeat Exercise 17.9, but for a third-order model and using y 5 top speed (mph) as the dependent variable.During the 1960s, manufacturers of the so-called “muscle cars” were accused of deliberately understating the massive amount of horsepower these engines produced.Examining the curve for the
An early edition of Car and Driver magazine reported the engine horsepower, top speed (mph), curb weight(pounds), and 0–60 mph acceleration time (seconds) for a selection of automobiles that ranged from large American“muscle cars” to small economy imports. The data are in file XR17009. Using
During the years 2005–2009, the world record for the 100-meter dash was repeatedly broken as never before. The years and corresponding record times are in data file XR17008 and shown in the table. Using x 5 1 through 5 to represent years 2005–2009, fit a secondorder polynomial model to the data
A travel research firm has reported average occupancy and room rates for hotels in 26 U.S. hotel markets.The data are also in file XR17007. For y 5 average room rate (dollars) and x 5 average occupancy rate (percent), fit a second-order polynomial model to the data and determine the percentage of
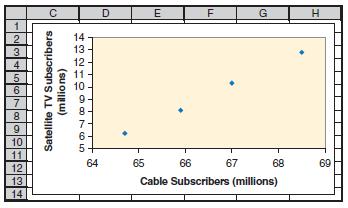
As the number of cable television subscribers has increased, the number of subscribers to satellite tele vi sion services has increased as well. For y 5 number of satellite subscribers and x 5 number of cable subscribers, the scatter diagram shown here has been constructed. Of the polynomial models
A communications firm employs a large number of technical sales representatives who make personal visits to potential customers. For data collected on y 5 average amount of sales per call and x 5 number of years of experience, the accompanying scatter diagram has been constructed. If a third-order
As the temperature increases, an experimental lubricant initially decreases in viscosity (resistance to flow), then increases, then decreases again. Of the polynomial models discussed in this section, which one would tend to be most applicable for such data? What would be the signs of the partial
As x increases, y decreases, and at an increasing rate. If a second-order polynomial model were fitted to the scatterplot of the data, what would be the signs of the partial regression coefficients in the model?
As x increases, y increases, but at a decreasing rate.If a second-order polynomial model were fitted to the scatterplot of the data, what would be the signs of the partial regression coefficients in the model?
Showing 300 - 400
of 2344
1
2
3
4
5
6
7
8
9
10
11
12
13
14
15
Last
Step by Step Answers