New Semester
Started
Get
50% OFF
Study Help!
--h --m --s
Claim Now
Question Answers
Textbooks
Find textbooks, questions and answers
Oops, something went wrong!
Change your search query and then try again
S
Books
FREE
Study Help
Expert Questions
Accounting
General Management
Mathematics
Finance
Organizational Behaviour
Law
Physics
Operating System
Management Leadership
Sociology
Programming
Marketing
Database
Computer Network
Economics
Textbooks Solutions
Accounting
Managerial Accounting
Management Leadership
Cost Accounting
Statistics
Business Law
Corporate Finance
Finance
Economics
Auditing
Tutors
Online Tutors
Find a Tutor
Hire a Tutor
Become a Tutor
AI Tutor
AI Study Planner
NEW
Sell Books
Search
Search
Sign In
Register
study help
business
business statistics in practice
The Practice Of Statistics 5th Edition Daren S. Starnes, Josh Tabor - Solutions
Marginal distributions aren’t the whole story Here are the row and column totals for a two-way table with two rows and two columns:a b 50 c d 50 60 40 100 Find two different sets of countsa, b,c, and d for the body of the table that give these same totals. This shows that the relationship between
Fuel economy (Introduction) Here is a small part of a data set that describes the fuel economy (in miles per gallon) of model year 2012 motor vehicles:Make and model Vehicle type Transmission type Number of cylinders City mpg Highway mpg Aston Martin Vantage Two-seater Manual 8 14 20 Honda Civic
Make and interpret dotplots and stemplots of quantitative data.
Describe the overall pattern (shape, center, and spread) of a distribution and identify any major departures from the pattern (outliers).
Identify the shape of a distribution from a graph as roughly symmetric or skewed.
Make and interpret histograms of quantitative data.
Compare distributions of quantitative data using dotplots, stemplots, or histograms.
Feeling sleepy? Students in a college statistics class responded to a survey designed by their teacher. One of the survey questions was “How much sleep did you get last night?” Here are the data (in hours):9 6 8 6 8 8 6 6.5 6 7 9 4 3 4 5 6 11 6 3 6 6 10 7 8 4.5 9 7 7(a) Make a dotplot to
Olympic gold! The following table displays the total number of gold medals won by a sample of countries in the 2012 Summer Olympic Games in London.Country Gold medals Country Gold medals Sri Lanka 0 Thailand 0 China 38 Kuwait 0 Vietnam 0 Bahamas 1 Great Britain 29 Kenya 2 Norway 2 Trinidad and
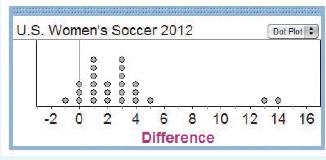
U.S. women’s soccer—2012 Earlier, we examined data on the number of goals scored by the U.S. women’s soccer team in games played in the 12 months prior to the 2012 Olympics. The dotplot below displays the goal differential for those same games, computed as U.S. score minus opponent’s
Fuel efficiency In an earlier example, we examined data on highway gas mileages of model year 2012 midsize cars. The following dotplot shows the difference(highway – city) in EPA mileage ratings for each of the 24 car models from the earlier example.-2 0 2 4 6 8 10 12 Difference (highway –
Dates on coins Suppose that you and your friends emptied your pockets of coins and recorded the year marked on each coin. The distribution of dates would be skewed to the left. Explain why.
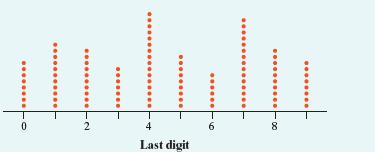
Phone numbers The dotplot below displays the last digit of 100 phone numbers chosen at random from a phone book. Describe the shape of the distribution.Does this shape make sense to you? Explain. 0 2 Last digit 00
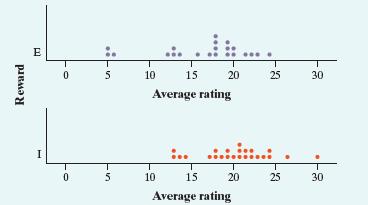
Creative writing Do external rewards—things like money, praise, fame, and grades—promote creativity?Researcher Teresa Amabile designed an experiment to find out. She recruited 47 experienced creative writers who were college students and divided them into two groups using a chance process (like
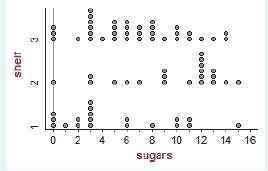
Healthy cereal? Researchers collected data on 77 brands of cereal at a local supermarket.25 For each brand, the sugar content (grams per serving) and the shelf in the store on which the cereal was located (1 =bottom, 2 = middle, 3 = top) were recorded. A dotplot of the data is shown below. Compare
Where do the young live? Below is a stemplot of the percent of residents aged 25 to 34 in each of the 50 states. As in the stemplot for older residents (page 33), the stems are whole percents, and the leaves are tenths of a percent. This time, each stem has been split in two, with values having
Watch that caffeine! The U.S. Food and Drug Administration (USFDA) limits the amount of caffeine in a 12-ounce can of carbonated beverage to 72 milligrams.That translates to a maximum of 48 milligrams of caffeine per 8-ounce serving. Data on the caffeine content of popular soft drinks (in
El Niño and the monsoon It appears that El Niño, the periodic warming of the Pacific Ocean west of South America, affects the monsoon rains that are essential for agriculture in India. Here are the monsoon rains (in millimeters) for the 23 strong El Niño years between 1871 and 2004:26 628 669
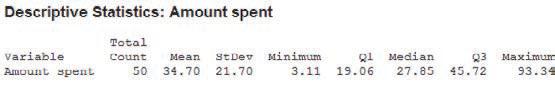
Shopping spree A marketing consultant observed 50 consecutive shoppers at a supermarket. One variable of interest was how much each shopper spent in the store. Here are the data (in dollars), arranged in increasing order:3.11 8.88 9.26 10.81 12.69 13.78 15.23 15.62 17.00 17.39 18.36 18.43 19.27
Do women study more than men? We asked the students in a large first-year college class how many minutes they studied on a typical weeknight. Here are the responses of random samples of 30 women and 30 men from the class:Women Men 180 120 180 360 240 90 120 30 90 200 120 180 120 240 170 90 45 30
Basketball playoffs Here are the numbers of points scored by teams in the California Division I-AAA high school basketball playoffs in a single day’s games:27 71 38 52 47 55 53 76 65 77 63 65 63 68 54 64 62 87 47 64 56 78 64 58 51 91 74 71 41 67 62 106 46 On the same day, the final scores of
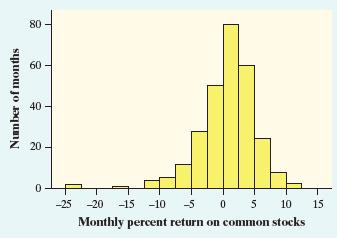
Returns on common stocks The return on a stock is the change in its market price plus any dividend payments made. Total return is usually expressed as a percent of the beginning price. The figure below shows a histogram of the distribution of the monthly returns for all common stocks listed on U.S.
Shakespeare The histogram below shows the distribution of lengths of words used in Shakespeare’s plays.29 Describe the shape, center, and spread of this distribution. 25 25 20 15 Percent of Shakespeare's words 1 1 2 3 4 5 67 8 9 10 11 12 Number of letters in word
Traveling to work How long do people travel each day to get to work? The following table gives the average travel times to work (in minutes) for workers in each state and the District of Columbia who are at least 16 years old and don’t work at home.30 AL 23.6 LA 25.1 OH 22.1 AK 17.7 ME 22.3 OK
DRP test scores There are many ways to measure the reading ability of children. One frequently used test is the Degree of Reading Power (DRP). In a research study on third-grade students, the DRP was administered to 44 students.32 Their scores were:40 26 39 14 42 18 25 43 46 27 19 47 19 26 35 34 15
Drive time Professor Moore, who lives a few miles outside a college town, records the time he takes to drive to the college each morning. Here are the times(in minutes) for 42 consecutive weekdays:8.25 7.83 8.30 8.42 8.50 8.67 8.17 9.00 9.00 8.17 7.92 9.00 8.50 9.00 7.75 7.92 8.00 8.08 8.42 8.75
The statistics of writing style Numerical data can distinguish different types of writing and, sometimes, even individual authors. Here are data on the percent of words of 1 to 15 letters used in articles in Popular Science magazine:33 Length: 1 2 3 4 5 6 7 8 9 10 11 12 13 14 15 Percent: 3.6 14.8
Chest out, Soldier! In 1846, a published paper provided chest measurements (in inches) of 5738 Scottish militiamen. The table below summarizes the data.34 Chest size Count Chest size Count 33 3 41 934 34 18 42 658 35 81 43 370 36 185 44 92 37 420 45 50 38 749 46 21 39 1073 47 4 40 1079 48 1(a) Make
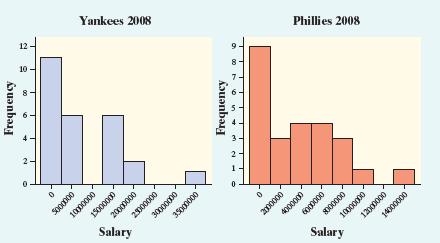
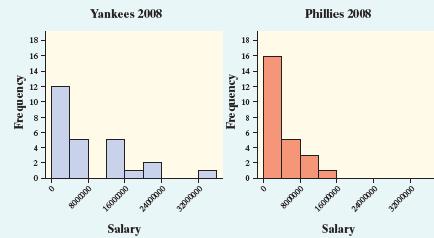
Paying for championships Does paying high salaries lead to more victories in professional sports? The New York Yankees have long been known for having Major League Baseball’s highest team payroll. And over the years, the team has won many championships.This strategy didn’t pay off in 2008, when
Paying for championships Refer to Exercise 59.Here is another graph of the 2008 salary distributions for the Yankees and the Phillies. Write a few sentences comparing these two distributions. Frequency 0 00 0000008 18 Yankees 2 2008 Phillies 2008 16000000 Salary 24000000 3:2000000 Frequency
Birth months Imagine asking a random sample of 60 students from your school about their birth months.Draw a plausible graph of the distribution of birth months. Should you use a bar graph or a histogram to display the data?
Die rolls Imagine rolling a fair, six-sided die 60 times. Draw a plausible graph of the distribution of die rolls. Should you use a bar graph or a histogram to display the data?
Who makes more? A manufacturing company is reviewing the salaries of its full-time employees below the executive level at a large plant. The clerical staff is almost entirely female, while a majority of the production workers and technical staff is male. As a result, the distributions of salaries
Comparing AP® scores The table below gives the distribution of grades earned by students taking the AP® Calculus AB and AP® Statistics exams in 2012.35 No. of exams Grade 5 4 3 2 1 Calculus AB 266,994 67,394 45,523 46,526 27,216 80,335 Statistics 153,859 19,267 32,521 39,355 27,684 35,032(a)
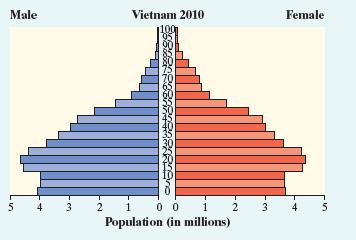
Population pyramids A population pyramid is a helpful graph for examining the distribution of a country’s population. Here is a population pyramid for Vietnam in the year 2010. Describe what the graph tells you about Vietnam’s population that year. Be specific. Male Vietnam 2010 100 Female 5 3
Population pyramids Refer to Exercise 65. Here is a graph of the projected population distribution for China in the year 2050. Describe what the graph suggests about China’s future population. Be specific. Male China 2050 Female 60 -of 48 36 24 12 00 12 24 36 48 60 Population (in millions)
Student survey A survey of a large high school class asked the following questions:(i) Are you female or male? (In the data, male = 0, female = 1.)(ii) Are you right-handed or left-handed? (In the data, right = 0, left = 1.)(iii) What is your height in inches?(iv) How many minutes do you study on a
Choose a graph What type of graph or graphs would you make in a study of each of the following issues at your school? Explain your choices.(a) Which radio stations are most popular with students?(b) How many hours per week do students study?(c) How many calories do students consume per day?
Here are the amounts of money (cents) in coins carried by 10 students in a statistics class: 50, 35, 0, 97, 76, 0, 0, 87, 23, 65. To make a stemplot of these data, you would use stems(a) 0, 1, 2, 3, 4, 5, 6, 7, 8, 9.(b) 0, 2, 3, 5, 6, 7, 8, 9.(c) 0, 3, 5, 6, 7.(d) 00, 10, 20, 30, 40, 50, 60, 70,
The histogram below shows the heights of 300 randomly selected high school students. Which of the following is the best description of the shape of the distribution of heights?(a) Roughly symmetric and unimodal (b) Roughly symmetric and bimodal (c) Roughly symmetric and multimodal (d) Skewed to the
You look at real estate ads for houses in Naples, Florida.There are many houses ranging from $200,000 to $500,000 in price. The few houses on the water, however, have prices up to $15 million. The distribution of house prices will be(a) skewed to the left.(b) roughly symmetric.(c) skewed to the
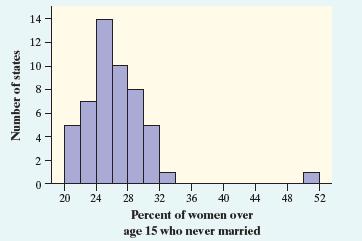
The following histogram shows the distribution of the percents of women aged 15 and over who have never married in each of the 50 states and the District of Columbia. Which of the following statements about the histogram is correct?(a) The center of the distribution is about 36%.(b) There are more
When comparing two distributions, it would be best to use relative frequency histograms rather than frequency histograms when(a) the distributions have different shapes.(b) the distributions have different spreads.(c) the distributions have different centers.(d) the distributions have different
Which of the following is the best reason for choosing a stemplot rather than a histogram to display the distribution of a quantitative variable?(a) Stemplots allow you to split stems; histograms don’t.(b) Stemplots allow you to see the values of individual observations.(c) Stemplots are better
Baseball players (Introduction) Here is a small part of a data set that describes Major League Baseball players as of opening day of the 2012 season:Player Team Position Age Height Weight Salary Rodriguez, Alex Yankees Infielder 37 6-3 225 29,000,000 Gonzalez, Adrian Dodgers Infielder 30 6-2 225
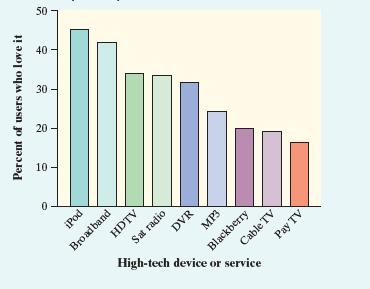
I love my iPod! (1.1) The rating service Arbitron asked adults who used several high-tech devices and services whether they “loved” using them. Below is a graph of the percents who said they did.36(a) Summarize what this graph tells you in a sentence or two.(b) Would it be appropriate to make a
Risks of playing soccer (1.1) A study in Sweden looked at former elite soccer players, people who had played soccer but not at the elite level, and people of the same age who did not play soccer. Here is a twoway table that classifies these individuals by whether or not they had arthritis of the
Risks of playing soccer (1.1) Refer to Exercise 77.We suspect that the more serious soccer players have more arthritis later in life. Do the data confirm this suspicion? Give graphical and numerical evidence to support your answer.
Calculate measures of center (mean, median).
Calculate and interpret measures of spread (range, IQR, standard deviation).
Choose the most appropriate measure of center and spread in a given setting.
Identify outliers using the 1.5 × IQR rule.
Make and interpret boxplots of quantitative data.
Use appropriate graphs and numerical summaries to compare distributions of quantitative variables.
Quiz grades Joey’s first 14 quiz grades in a marking period were 86 84 91 75 78 80 74 87 76 96 82 90 98 93 Calculate the mean. Show your work.
Cowboys The 2011 roster of the Dallas Cowboys professional football team included 7 defensive linemen.Their weights (in pounds) were 321, 285, 300, 285, 286, 293, and 298. Calculate the mean. Show your work.
Quiz grades Refer to Exercise 79.(a) Find the median by hand. Show your work.(b) Suppose Joey has an unexcused absence for the 15th quiz, and he receives a score of zero. Recalculate the mean and the median. What property of measures of center does this illustrate?
Cowboys Refer to Exercise 80.(a) Find the median by hand. Show your work.(b) Suppose the heaviest lineman had weighed 341 pounds instead of 321 pounds. How would this change affect the mean and the median? What property of measures of center does this illustrate?
Incomes of college grads According to the Census Bureau, the mean and median income in a recent year of people at least 25 years old who had a bachelor’s degree but no higher degree were $48,097 and$60,954. Which of these numbers is the mean and which is the median? Explain your reasoning.
House prices The mean and median selling prices of existing single-family homes sold in July 2012 were$263,200 and $224,200.41 Which of these numbers is the mean and which is the median? Explain how you know.
Baseball salaries Suppose that a Major League Baseball team’s mean yearly salary for its players is $1.2 million and that the team has 25 players on its active roster. What is the team’s total annual payroll? If you knew only the median salary, would you be able to answer this question? Why or
Mean salary? Last year a small accounting firm paid each of its five clerks $22,000, two junior accountants$50,000 each, and the firm’s owner $270,000. What is the mean salary paid at this firm? How many of the employees earn less than the mean? What is the median salary? Write a sentence to
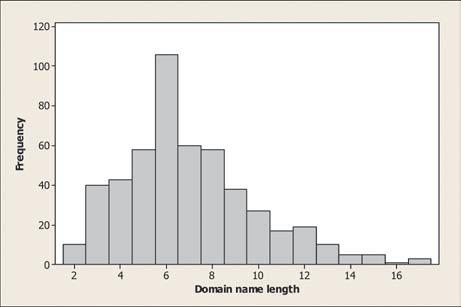
Domain names When it comes to Internet domain names, is shorter better? According to one ranking of Web sites in 2012, the top 8 sites (by number of“hits”) were google.com, youtube.com, wikipedia.org, yahoo.com, amazon.com, ebay.com, craigslist.org, and facebook.com. These familiar sites
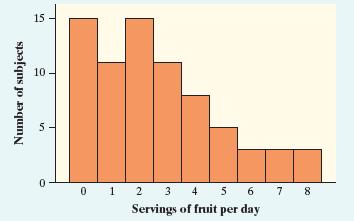
Do adolescent girls eat fruit? We all know that fruit is good for us. Below is a histogram of the number of servings of fruit per day claimed by 74 seventeen-yearold girls in a study in Pennsylvania.42(a) With a little care, you can find the median and the quartiles from the histogram. What are
Quiz grades Refer to Exercise 79.(a) Find and interpret the interquartile range (IQR).(b) Determine whether there are any outliers. Show your work.90. Cowboys Refer to Exercise 80.(a) Find and interpret the interquartile range (IQR).(b) Determine whether there are any outliers. Show your work.
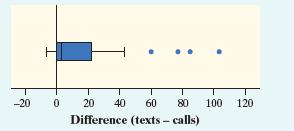
Don’t call me In a September 28, 2008, article titled“Letting Our Fingers Do the Talking,” the New York Times reported that Americans now send more text messages than they make phone calls. According to a study by Nielsen Mobile, “Teenagers ages 13 to 17 are by far the most prolific
Acing the first test Here are the scores of Mrs. Liao’s students on their first statistics test:93 93 87.5 91 94.5 72 96 95 93.5 93.5 73 82 45 88 80 86 85.5 87.5 81 78 86 89 92 91 98 85 82.5 88 94.5 43(a) Make a boxplot of the test score data by hand. Be sure to check for outliers.(b) How did the
Texts or calls? Refer to Exercise 91. A boxplot of the difference (texts – calls) in the number of texts and calls for each student is shown below.(a) Do these data support the claim in the article abouttexting versus calling? Justify your answer with appropriate evidence.(b) Can we draw any
Electoral votes To become president of the United States, a candidate does not have to receive a majority of the popular vote. The candidate does have to win a majority of the 538 electoral votes that are cast in the Electoral College. Here is a stemplot of the number of electoral votes for each of
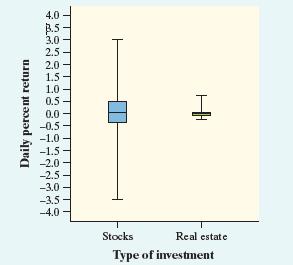
Comparing investments Should you put your money into a fund that buys stocks or a fund that invests in real estate? The boxplots compare the daily returns(in percent) on a “total stock market” fund and a real estate fund over a one-year period.43(a) Read the graph: about what were the highest
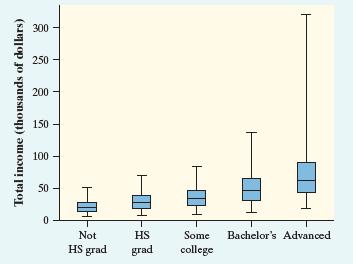
Income and education level Each March, the Bureau of Labor Statistics compiles an Annual Demographic Supplement to its monthly Current Population Survey.44 Data on about 71,067 individuals between the ages of 25 and 64 who were employed full-time were collected in one of these surveys. The boxplots
Phosphate levels The level of various substances in the blood influences our health. Here are measurements of the level of phosphate in the blood of a patient, in milligrams of phosphate per deciliter of blood, made on 6 consecutive visits to a clinic: 5.6, 5.2, 4.6, 4.9, 5.7, 6.4. A graph of only
Feeling sleepy? The first four students to arrive for a first-period statistics class were asked how much sleep (to the nearest hour) they got last night. Their responses were 7, 7, 9, and 9.(a) Find the standard deviation from its definition. That is, find the deviations of each observation from
Shopping spree The figure displays computer output for data on the amount spent by 50 grocery shoppers.(a) What would you guess is the shape of the distribution based only on the computer output? Explain.(b) Interpret the value of the standard deviation.(c) Are there any outliers? Justify your
C-sections Do male doctors perform more cesarean sections (C-sections) than female doctors? A study in Switzerland examined the number of cesarean sections (surgical deliveries of babies) performed in a year by samples of male and female doctors. Here are summary statistics for the two
The IQR Is the interquartile range a resistant measure of spread? Give an example of a small data set that supports your answer.
What do they measure? For each of the following summary statistics, decide (i) whether it could be used to measure center or spread and (ii) whether it is resistant.(a)Q1 + Q3 2(b)Max −Min 2
SD contest This is a standard deviation contest. You must choose four numbers from the whole numbers 0 to 10, with repeats allowed.(a) Choose four numbers that have the smallest possible standard deviation.(b) Choose four numbers that have the largest possible standard deviation.(c) Is more than
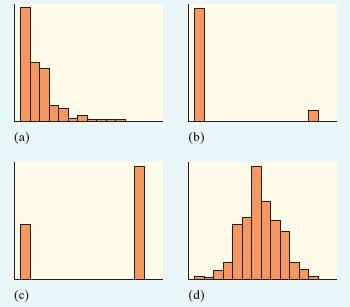
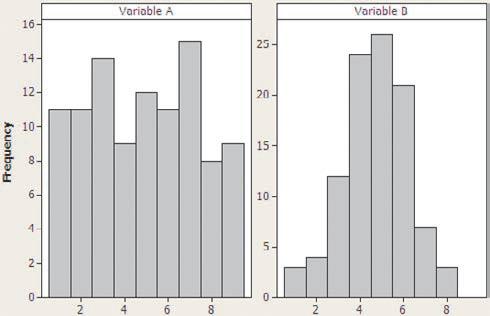
Measuring spread Which of the distributions shown has a larger standard deviation? Justify your answer. Variable A 16- 14- 25- 12- 20- 10- 15- Frequency 4. 2- 0 F2 -4 6 76 00- 10- 5. 0 Variable D 2 N- 4 8 .co -6.
SSHA scores Here are the scores on the Survey of Study Habits and Attitudes (SSHA) for 18 first-year college women:154 109 137 115 152 140 154 178 101 103 126 126 137 165 165 129 200 148 and for 20 first-year college men:108 140 114 91 180 115 126 92 169 146 109 132 75 88 113 151 70 115 187 104 Do
Hummingbirds and tropical flower Researchers from Amherst College studied the relationship between varieties of the tropical flower Heliconia on the island of Dominica and the different species of hummingbirds that fertilize the flowers.45 Over time, the researchers believe, the lengths of the
If a distribution is skewed to the right with no outliers,(a) mean < median. (d) mean > median.(b) mean ≈ median. (e) We can’t tell without(c) mean = median. examining the data.
The stemplot shows the number of home runs hit by each of the 30 Major League Baseball teams in 2011.Home run totals above what value should be considered outliers?09 10 11 12 13 14 15 16 17 18 19 20 21 22 15 3789 47 19 89 34445 239 223 356 1302 Key: 14|8 is a team with 148 home runs.(a) 173 (b)
How tall are you? (1.2) Here are the students’ heights(in centimeters).166.5 170 178 163 150.5 169 173 169 171 166 190 183 178 161 171 170 191 168.5 178.5 173 175 160.5 166 164 163 174 160 174 182 167 166 170 170 181 171.5 160 178 157 165 187 168 157.5 145.5 156 182 168.5 177 162.5 160.5 185.5
How tall are you? (1.2) Here are the students’ heights(in centimeters).166.5 170 178 163 150.5 169 173 169 171 166 190 183 178 161 171 170 191 168.5 178.5 173 175 160.5 166 164 163 174 160 174 182 167 166 170 170 181 171.5 160 178 157 165 187 168 157.5 145.5 156 182 168.5 177 162.5 160.5 185.5
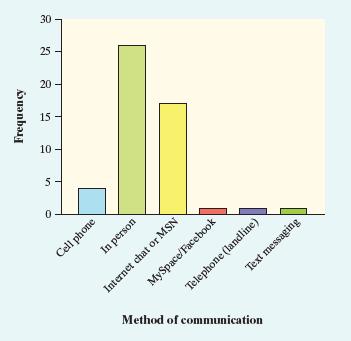
Let’s chat (1.1) The bar graph displays data on students’ responses to the question “Which of these methods do you most often use to communicate with your friends?”Let’s chat (1.1) The bar graph displays data on students’ responses to the question “Which of these methods do you most
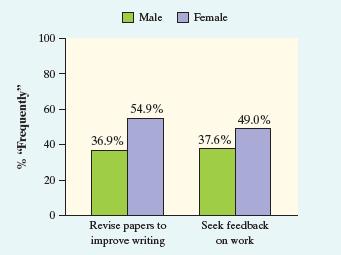
Success in college (1.1) The 2007 Freshman Survey asked first-year college students about their “habits of mind”—specific behaviors that college faculty have identified as being important for student success. One question asked students, “How often in the past year did you revise your
Hit movies According to the Internet Movie Database, Avatar is tops based on box office sales worldwide.The following table displays data on several popular movies.47 Time Box office Movie Year Rating (minutes) Genre (dollars)Avatar 2009 PG-13 162 Action 2,781,505,847 Titanic 1997 PG-13 194 Drama
Movie ratings The movie rating system we use today was first established on November 1, 1968. Back then, the possible ratings were G, PG, R, and X. In 1984, the PG-13 rating was created. And in 1990, NC-17 replaced the X rating. Here is a summary of the ratings assigned to movies between 1968 and
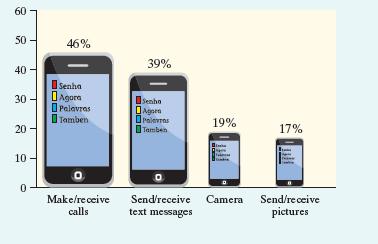
I’d die without my phone! In a survey of over 2000 U.S. teenagers by Harris Interactive, 47% said that“their social life would end or be worsened without their cell phone.”49 One survey question asked the teens how important it is for their phone to have certain features. The figure below
Facebook and age Is there a relationship between Facebook use and age among college students? The following two-way table displays data for the 219 students who responded to the survey.50 Age Facebook user?Younger(18–22)Middle(23–27)Older(28 and up)Yes 78 49 21 No 4 21 46(a) What percent of the
Facebook and age Use the data in the previous exercise to determine whether there is an association between Facebook use and age. Give appropriate graphical and numerical evidence to support your answer.
Density of the earth In 1798, the English scientist Henry Cavendish measured the density of the earth several times by careful work with a torsion balance.The variable recorded was the density of the earth as a multiple of the density of water. Here are Cavendish’s 29 measurements:51 5.50 5.61
Guinea pig survival times Here are the survival times in days of 72 guinea pigs after they were injected with infectious bacteria in a medical experiment.52 Survival times, whether of machines under stress or cancer patients after treatment, usually have distributions that are skewed to the
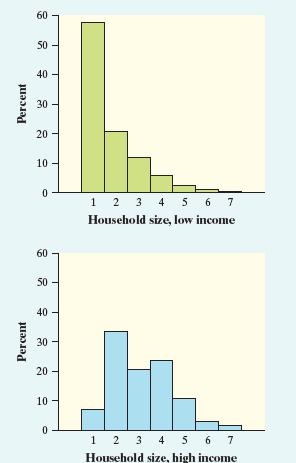
Household incomes Rich and poor households differ in ways that go beyond income. Following are histograms that compare the distributions of household size(number of people) for low-income and high-income households.53 Low-income households had annual incomes less than $15,000, and high-income
Mercury in tuna A histogram and some computer output provide information about the mercury concentration in the sampled cans (in parts per million, ppm).Descriptive Statistics: Mercury_ppm Variable N Mean StDev Min Mercury 164 0.285 0.300 0.012 Variable Q1 Med Q3 Max Mercury 0.071 0.180 0.380 1.500
Mercury in tuna Is there a difference in the mercury concentration of light tuna and albacore tuna? Use the parallel boxplots and the computer output to write a few sentences comparing the two distributions.Descriptive Statistics: Mercury_ppm Type N Mean StDev Min Albacore 20 0.401 0.152 0.170
You record the age, marital status, and earned income of a sample of 1463 women. The number and type of variables you have recorded is(a) 3 quantitative, 0 categorical.(b) 4 quantitative, 0 categorical.(c) 3 quantitative, 1 categorical.(d) 2 quantitative, 1 categorical.(e) 2 quantitative, 2
Consumers Union measured the gas mileage in miles per gallon of 38 vehicles from the same model year on a special test track. The pie chart provides information about the country of manufacture of the model cars tested by Consumers Union. Based on the pie chart, we conclude that(a) Japanese cars
Which of the following bar graphs is equivalent to the pie chart in Question T1.2?(e) None of these. (a) 15 10 5 (b) 25 France Germany Italy Japan Sweden U.S. 20 20 15 10 5- France Germany Italy Japan Sweden U.S.
Showing 5000 - 5100
of 6217
First
44
45
46
47
48
49
50
51
52
53
54
55
56
57
58
Last
Step by Step Answers