New Semester
Started
Get
50% OFF
Study Help!
--h --m --s
Claim Now
Question Answers
Textbooks
Find textbooks, questions and answers
Oops, something went wrong!
Change your search query and then try again
S
Books
FREE
Study Help
Expert Questions
Accounting
General Management
Mathematics
Finance
Organizational Behaviour
Law
Physics
Operating System
Management Leadership
Sociology
Programming
Marketing
Database
Computer Network
Economics
Textbooks Solutions
Accounting
Managerial Accounting
Management Leadership
Cost Accounting
Statistics
Business Law
Corporate Finance
Finance
Economics
Auditing
Tutors
Online Tutors
Find a Tutor
Hire a Tutor
Become a Tutor
AI Tutor
AI Study Planner
NEW
Sell Books
Search
Search
Sign In
Register
study help
business
business statistics in practice
The Practice Of Statistics 5th Edition Daren S. Starnes, Josh Tabor - Solutions
A beef rancher randomly sampled 42 cattle from her large herd to obtain a 95% confidence interval to estimate the mean weight of the cows in the herd. The interval obtained was (1010, 1321). If the rancher had used a 98% confidence interval instead, the interval would have been(a) wider and would
School A has 400 students and School B has 2700 students. A local newspaper wants to compare the distributions of SAT scores for the two schools.Which of the following would be the most useful for making this comparison?(a) Back-to-back stemplots for A and B(b) A scatterplot of A versus B(c)
Let X represent the outcome when a fair six-sided die is rolled. For this random variable, mX = 3.5 and sX = 1.71. If the die is rolled 100 times, what is the approximate probability that the total score is at least 375?(a) 0.0000 (c) 0.0721 (e) 0.9279(b) 0.0017 (d) 0.4420
An agricultural station is testing the yields for six different varieties of seed corn. The station has four large fields available, which are located in four distinctly different parts of the county. The agricultural researchers consider the climatic and soil conditions in the four parts of the
The correlation between the heights of fathers and the heights of their (grownup) sons is r = 0.52, both measured in inches. If fathers’ heights were measured in feet instead, the correlation between heights of fathers and heights of sons would be(a) much smaller than 0.52.(b) slightly smaller
A random sample of 200 New York State voters included 88 Republicans, while a random sample of 300 California voters produced 141 Republicans.Which of the following represents the 95% confidence interval that should be used to estimate the true difference in the proportions of Republicans in New
Which of the following is not a property of a binomial setting?(a) Outcomes of different trials are independent.(b) The chance process consists of a fixed number of trials, n.(c) The probability of success is the same for each trial.(d) Trials are repeated until a success occurs.(e) Each trial can
Mrs. Woods and Mrs. Bryan are avid vegetable gardeners. They use different fertilizers, and each claims that hers is the best fertilizer to use when growing tomatoes. Both agree to do a study using the weight of their tomatoes as the response variable.They had each planted the same varieties of
The Environmental Protection Agency is charged with monitoring industrial emissions that pollute the atmosphere and water. So long as emission levels stay within specified guidelines, the EPA does not take action against the polluter. If the polluter is in violation of the regulations, the offender
Which of the following is false?(a) A measure of center alone does not completely describe the characteristics of a set of data. Some measure of spread is also needed.(b) If the original measurements are in inches, converting them to centimeters will not change the mean or standard deviation.(c)
A 96% confidence interval for the proportion of the labor force that is unemployed in a certain city is (0.07, 0.10). Which of the following statements about this interval is true?(a) The probability is 0.96 that between 7% and 10% of the labor force is unemployed.(b) About 96% of the intervals
A large toy company introduces a lot of new toys to its product line each year. The company wants to predict the demand as measured by y, first-year sales (in millions of dollars) using x, awareness of the product (as measured by the percent of customers who had heard of the product by the end of
Final grades for a class are approximately Normally distributed with a mean of 76 and a standard deviation of 8. A professor says that the top 10% of the class will receive an A, the next 20% a B, the next 40% a C, the next 20% a D, and the bottom 10% an F. What is the approximate maximum grade a
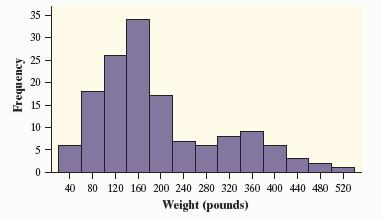
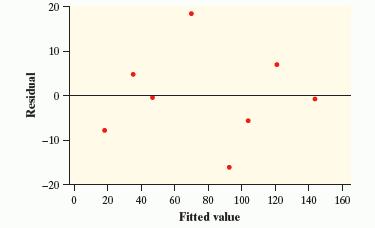
National Park rangers keep data on the bears that inhabit their park. Below is a histogram of the weights of 143 bears measured in a recent year.Which statement below is correct?(a) The median will lie in the interval (140, 180), and the mean will lie in the interval (180, 220).(b) The median will
A random sample of size n will be selected from a population, and the proportion of those in the sample who have a Facebook page will be calculated.How would the margin of error for a 95%confidence interval be affected if the sample size were increased from 50 to 200?(a) It remains the same.(b) It
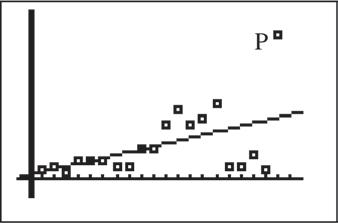
A scatterplot and a least-squares regression line are shown in the figure below. What effect does point P have on the slope of the regression line and the correlation?(a) Point P increases the slope and increases the correlation.(b) Point P increases the slope and decreases the correlation.(c)
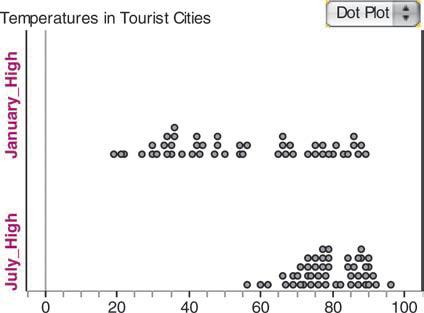
The following dotplots show the average high temperatures(in degrees Fahrenheit) for a sample of tourist cities from around the world. Both the January and July average high temperatures are shown.What is one statement that can be made with certainty from an analysis of the graphical display?(a)
Suppose the null and alternative hypotheses for a significance test are defined as H0 : m = 40 Ha : m < 40 Which of the following specific values for Ha will give the highest power?(a) m = 38 (c) m = 40 (e) m = 42(b) m = 39 (d) m = 41
A large university is considering the establishment of a schoolwide recycling program. To gauge interest in the program by means of a questionnaire, the university takes separate random samples of undergraduate students, graduate students, faculty, and staff. This is an example of what type of
Suppose the true proportion of people who use public transportation to get to work in the Washington, D.C., area is 0.45. In a simple random sample of 250 people who work in Washington, about how far do you expect the sample proportion to be from the true proportion?(a) 0.4975 (c) 0.0315 (e) 0(b)
If we are interested in whether students at this high school are getting too little sleep, which of the following represents the appropriate null and alternative hypotheses?(a) H0 : m = 7.9 and Ha : m < 7.9(b) H0 : m = 7.9 and Ha : m ≠ 7.9(c) H0 : m = 9 and Ha : m ≠ 9(d) H0 : m = 9 and Ha : m <
A researcher wants to determine whether or not a five-week crash diet is effective over a long period of time. A random sample of 15 dieters is selected.Each person’s weight is recorded before starting the diet and one year after it is concluded. Based on the data shown at right (weight in
Which of the following is the test statistic for the hypothesis test?(a) t =7.9 − 9 2.1!28(b) t =9 − 7.9 2.1!28(c) t =7.9 − 9Å2.1 28(d) t =7.9 − 9 2.1!27(e) t =9 − 7.9 2.1!27
Shortly before the 2012 presidential election, a survey was taken by the school newspaper at a very large state university. Randomly selected students were asked, “Whom do you plan to vote for in the upcoming presidential election?” Here is a twoway table of the responses by political
A researcher wants to determine whether or not a five-week crash diet is effective over a long period of time. A random sample of 15 dieters is selected.Each person’s weight is recorded before starting the diet and one year after it is concluded. Based on the data shown at right (weight in
Starting in the 1970s, medical technology allowed babies with very low birth weight (VLBW, less than 1500 grams, or about 3.3 pounds) to survive without major handicaps. It was noticed that these children nonetheless had difficulties in school and as adults.A long study has followed 242 randomly
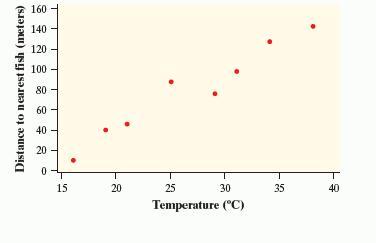
A nuclear power plant releases water into a nearby lake every afternoon at 4:51 p.m. Environmental researchers are concerned that fish are being driven away from the area around the plant. They believe that the temperature of the water discharged may be a factor. The scatterplot below shows the
The Candy Shoppe assembles gift boxes that contain 8 chocolate truffles and 2 handmade caramel nougats. The truffles have a mean weight of 2 ounces with a standard deviation of 0.5 ounce, and the nougats have a mean weight of 4 ounces with a standard deviation of 1 ounce.The empty boxes weigh 3
An investor is comparing two stocks, A and B.She wants to know if over the long run, there is a significant difference in the return on investment as measured by the percent increase or decrease in the price of the stock from its date of purchase. The investor takes a random sample of 50 annualized
Distinguish between a parameter and a statistic.
Use the sampling distribution of a statistic to evaluate a claim about a parameter.
Distinguish among the distribution of a population, the distribution of a sample, and the sampling distribution of a statistic.
Determine whether or not a statistic is an unbiased estimator of a population parameter.
Describe the relationship between sample size and the variability of a statistic.
On Tuesday, the bottles of Arizona Iced Tea filled in a plant were supposed to contain an average of 20 ounces of iced tea. Quality control inspectors sampled 50 bottles at random from the day’s production. These bottles contained an average of 19.6 ounces of iced tea.
On a New York–to–Denver flight, 8% of the 125 passengers were selected for random security screening before boarding. According to the Transportation Security Administration, 10% of passengers at this airport are chosen for random screening.
Healthy living(a) A random sample of 1000 people who signed a card saying they intended to quit smoking were contacted 9 months later. It turned out that 210 (21%) of the sampled individuals had not smoked over the past 6 months.(b) Tom is cooking a large turkey breast for a holiday meal. He wants
The economy(a) Each month, the Current Population Survey interviews a random sample of individuals in about 60,000 U.S. households. One of their goals is to estimate the national unemployment rate. In October 2012, 7.9% of those interviewed were unemployed.(b) How much do gasoline prices vary in a
Get your bearings A large container is full of ball bearings with mean diameter 2.5003 centimeters (cm).This is within the specifications for acceptance of the container by the purchaser. By chance, an inspector chooses 100 bearings from the container that have mean diameter 2.5009 cm. Because this
Voters Voter registration records show that 41% of voters in a state are registered as Democrats. To test a random digit dialing device, you use it to call 250 randomly chosen residential telephones in the state.Of the registered voters contacted, 33% are registered Democrats.
Unlisted numbers A telemarketing firm in a large city uses a device that dials residential telephone numbers in that city at random. Of the first 100 numbers dialed, 48% are unlisted. This is not surprising because 52% of all residential phones in the city are unlisted.
How tall? A random sample of female college students has a mean height of 64.5 inches, which is greater than the 63-inch mean height of all adult American women.
Sampling distribution(a) List all 15 possible SRSs of size n = 2 from the population.Find the value of x– for each sample.(b) Make a graph of the sampling distribution of x–.Describe what you see.
Sampling distribution(a) List all 15 possible SRSs of size n = 2 from the population.Find the value of the range for each sample.(b) Make a graph of the sampling distribution of the sample range. Describe what you see.
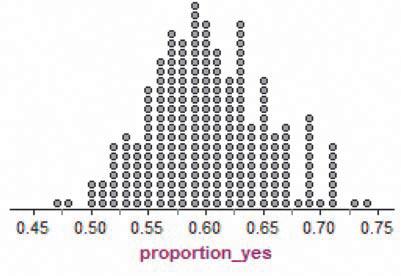
Doing homework A school newspaper article claims that 60% of the students at a large high school did all their assigned homework last week. Some skeptical AP® Statistics students want to investigate whether this claim is true, so they choose an SRS of 100 students from the school to interview.
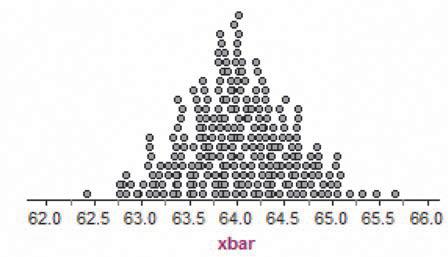
Tall girls According to the National Center for Health Statistics, the distribution of heights for 16-year-old females is modeled well by a Normal density curve with mean m = 64 inches and standard deviation s = 2.5 inches. To see if this distribution applies at their high school, an AP®Statistics
Doing homework Refer to Exercise 9.(a) Make a bar graph of the population distribution given that the newspaper’s claim is correct.(b) Sketch a possible graph of the distribution of sample data for the SRS of size 100 taken by the AP® Statistics students.
Tall girls Refer to Exercise 10.(a) Make a graph of the population distribution.(b) Sketch a possible dotplot of the distribution of sample data for the SRS of size 20 taken by the AP®Statistics class.
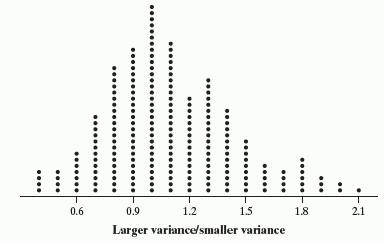
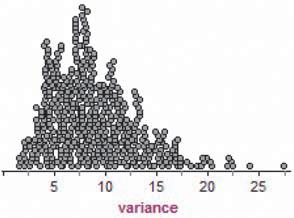
Cold cabin? The Fathom screen shot below shows the results of taking 500 SRSs of 10 temperature readings from a population distribution that is N(50, 3)and recording the sample variance s2x each time.(a) Describe the approximate sampling distribution.(b) Suppose that the variance from an actual
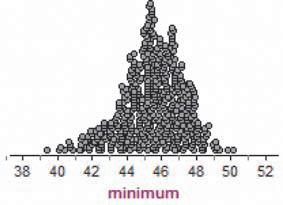
Cold cabin? The Fathom screen shot below shows the results of taking 500 SRSs of 10 temperature readings from a population distribution that is N(50, 3)and recording the sample minimum each time.(a) Describe the approximate sampling distribution.(b) Suppose that the minimum of an actual sample is
A sample of teens A study of the health of teenagers plans to measure the blood cholesterol levels of an SRS of 13- to 16-year-olds. The researchers will report the mean x– from their sample as an estimate of the mean cholesterol level m in this population. Explain to someone who knows little
Predict the election A polling organization plans to ask a random sample of likely voters who they plan to vote for in an upcoming election. The researchers will report the sample proportion p^ that favors the incumbent as an estimate of the population proportion p that favors the incumbent.
A sample of teens Refer to Exercise 15. The sample mean x– is an unbiased estimator of the population mean m no matter what size SRS the study chooses.Explain to someone who knows nothing about statistics why a large random sample will give more trustworthy results than a small random sample.
Predict the election Refer to Exercise 16. The sample proportion p^ is an unbiased estimator of the population proportion p no matter what size random sample the polling organization chooses. Explain to someone who knows nothing about statistics why a large random sample will give more trustworthy
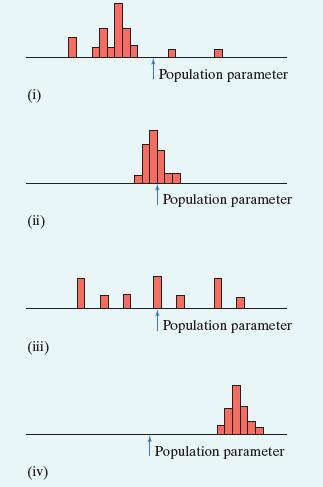
Bias and variability The figure below shows histograms of four sampling distributions of different statistics intended to estimate the same parameter.(a) Which statistics are unbiased estimators? Justify your answer.(b) Which statistic does the best job of estimating the parameter? Explain. (i)
IRS audits The Internal Revenue Service plans to examine an SRS of individual federal income tax returns. The parameter of interest is the proportion of all returns claiming itemized deductions. Which would be better for estimating this parameter: an SRS of 20,000 returns or an SRS of 2000
receiving some kind of financial aid. The school newspaper selects a random sample of 100 students and 72% of the respondents say they are receiving some sort of financial aid. Which of the following is true?(a) 78% is a population and 72% is a sample.(b) 72% is a population and 78% is a sample.(c)
A statistic is an unbiased estimator of a parameter when(a) the statistic is calculated from a random sample.(b) in a single sample, the value of the statistic is equal to the value of the parameter.(c) in many samples, the values of the statistic are very close to the value of the parameter.(d) in
In a residential neighborhood, the median value of a house is $200,000. For which of the following sample sizes is the sample median most likely to be above $250,000?(a) n = 10(b) n = 50(c) n = 100(d) n = 1000(e) Impossible to determine without more information.
Tom is cooking a large turkey breast for a holiday meal. He wants to be sure that the turkey is safe to eat, which requires a minimum internal temperature of 165°F. Tom uses a thermometer to measure the temperature of the turkey meat at four randomly chosen points. If the minimum reading in the
Increasing the sample size of an opinion poll will reduce the(a) bias of the estimates made from the data collected in the poll.(b) variability of the estimates made from the data collected in the poll.(c) effect of nonresponse on the poll.(d) variability of opinions in the sample.(e) variability
Dem bones (2.2) Osteoporosis is a condition in which the bones become brittle due to loss of minerals. To diagnose osteoporosis, an elaborate apparatus measures bone mineral density (BMD).BMD is usually reported in standardized form. The standardization is based on a population of healthy young
Squirrels and their food supply (3.2) Animal species produce more offspring when their supply of food goes up. Some animals appear able to anticipate unusual food abundance. Red squirrels eat seeds from pinecones, a food source that sometimes has very large crops. Researchers collected data on an
Find the mean and standard deviation of the sampling distribution of a sample proportion p^. Check the 10%condition before calculating sp^.
Determine if the sampling distribution of p^ is approximately Normal.
If appropriate, use a Normal distribution to calculate probabilities involving p^.
How is the sampling distribution of p^ related to the binomial count X ?
The candy machine Suppose a large candy machine has 45% orange candies. Use Figures 7.11 and 7.12(pages 441 and 442) to help answer the following questions.(a) Would you be surprised if a sample of 25 candies from the machine contained 8 orange candies (that’s 32% orange)? How about 5 orange
The candy machine Suppose a large candy machine has 15% orange candies. Use Figure 7.13(page 442) to help answer the following questions.(a) Would you be surprised if a sample of 25 candies from the machine contained 8 orange candies (that’s 32% orange)? How about 5 orange candies (20%orange)?
The candy machine Suppose a large candy machine has 45% orange candies. Imagine taking an SRS of 25 candies from the machine and observing the sample proportion p^ of orange candies.(a) What is the mean of the sampling distribution of p^ ?Why?(b) Find the standard deviation of the sampling
The candy machine Suppose a large candy machine has 15% orange candies. Imagine taking an SRS of 25 candies from the machine and observing the sample proportion p^ of orange candies.(a) What is the mean of the sampling distribution of p^ ?Why?(b) Find the standard deviation of the sampling
Airport security The Transportation Security Administration(TSA) is responsible for airport safety.On some flights, TSA officers randomly select passengers for an extra security check before boarding.One such flight had 76 passengers—12 in first class and 64 in coach class. TSA officers selected
Scrabble In the game of Scrabble, each player begins by drawing 7 tiles from a bag containing 100 tiles. There are 42 vowels, 56 consonants, and 2 blank tiles in the bag. Cait chooses an SRS of 7 tiles. Let p^ be the proportion of vowels in her sample.(a) Is the 10% condition met in this case?
Hispanic workers A factory employs 3000 unionized workers, of whom 30% are Hispanic. The 15-member union executive committee contains 3 Hispanics. What would be the probability of 3 or fewer Hispanics if the executive committee were chosen at random from all the workers?
Studious athletes A university is concerned about the academic standing of its intercollegiate athletes.A study committee chooses an SRS of 50 of the 316 athletes to interview in detail. Suppose that 40% of the athletes have been told by coaches to neglect their studies on at least one occasion.
Do you drink the cereal milk? A USA Today Poll asked a random sample of 1012 U.S. adults what they do with the milk in the bowl after they have eaten the cereal. Let p^ be the proportion of people in the sample who drink the cereal milk. A spokesman for the dairy industry claims that 70% of all
Do you go to church? The Gallup Poll asked a random sample of 1785 adults whether they attended church during the past week. Let p^ be the proportion of people in the sample who attended church. A newspaper report claims that 40% of all U.S. adults went to church last week. Suppose this claim is
Do you drink the cereal milk? What sample size would be required to reduce the standard deviation of the sampling distribution to one-half the value you found in Exercise 35(b)? Justify your answer.
Do you go to church? What sample size would be required to reduce the standard deviation of the sampling distribution to one-third the value you found in Exercise 36(b)? Justify your answer.
Students on diets A sample survey interviews an SRS of 267 college women. Suppose that 70% of college women have been on a diet within the past 12 months. What is the probability that 75% or more of the women in the sample have been on a diet? Show your work.
Who owns a Harley? Harley-Davidson motorcycles make up 14% of all the motorcycles registered in the United States. You plan to interview an SRS of 500 motorcycle owners. How likely is your sample to contain 20% or more who own Harleys? Show your work.
On-time shipping A mail-order company advertises that it ships 90% of its orders within three working days. You select an SRS of 100 of the 5000 orders received in the past week for an audit. The audit reveals that 86 of these orders were shipped on time.(a) If the company really ships 90% of its
Study finds that 67% of college students support efforts to “crack down on underage drinking.” Does this result hold at a large local college? To find out, college administrators survey an SRS of 100 students and find that 62 support a crackdown on underage drinking.(a) Suppose that the
Which of the following are the mean and standard deviation of the sampling distribution of the sample proportion p^ ?(a) Mean = 0.30, SD = 0.017(b) Mean = 0.30, SD = 0.55(c) Mean = 0.30, SD = 0.0003(d) Mean = 225, SD = 12.5(e) Mean = 225, SD = 157.5
Decreasing the sample size from 750 to 375 would multiply the standard deviation by(a) 2. (c) 1/2. (e) none of these.(b) !2. (d) 1•!2.
The sampling distribution of p^ is approximately Normal because (a) there are at least 7500 Division I college athletes.(b) np = 225 and n(1 − p) = 525 are both at least 10.(c) a random sample was chosen.(d) the athletes’ responses are quantitative.(e) the sampling distribution of p^ always has
In a congressional district, 55% of the registered voters are Democrats. Which of the following is equivalent to the probability of getting less than 50%Democrats in a random sample of size 100?(a) PaZ
Sharing music online (5.2) A sample survey reports that 29% of Internet users download music files online, 21% share music files from their computers, and 12% both download and share music.5 Make a Venn diagram that displays this information. What percent of Internet users neither download nor
California’s endangered animals (4.1) The California Department of Fish and Game publishes a list of the state’s endangered animals. The reptiles on the list are given below.Desert tortoise Southern rubber boa Olive Ridley sea turtle Loggerhead sea turtle Island night lizard Barefoot banded
Find the mean and standard deviation of the sampling distribution of a sample mean x–. Check the 10% condition before calculating sx–.
Explain how the shape of the sampling distribution of x–is affected by the shape of the population distribution and the sample size.
If appropriate, use a Normal distribution to calculate probabilities involving x–.
Find the probability that a randomly chosen pregnant woman has a pregnancy that lasts for more than 270 days. Show your work.Suppose we choose an SRS of 6 pregnant women. Let x– = the mean pregnancy length for the sample.
What is the mean of the sampling distribution of x–? Explain.
Compute the standard deviation of the sampling distribution of x–. Check that the 10% condition is met.
Find the probability that the mean pregnancy length for the women in the sample exceeds 270 days. Show your work.
Songs on an iPod David’s iPod has about 10,000 songs. The distribution of the play times for these songs is heavily skewed to the right with a mean of 225 seconds and a standard deviation of 60 seconds.Suppose we choose an SRS of 10 songs from this population and calculate the mean play time x–
Making auto parts A grinding machine in an auto parts plant prepares axles with a target diameter m = 40.125 millimeters (mm). The machine has some variability, so the standard deviation of the diameters is s = 0.002 mm. The machine operator inspects a random sample of 4 axles each hour for quality
Making auto parts A grinding machine in an auto parts plant prepares axles with a target diameter m = 40.125 millimeters (mm). The machine has some variability, so the standard deviation of the diameters is s = 0.002 mm. The machine operator inspects a random sample of 4 axles each hour for quality
Making auto parts Refer to Exercise 50. How many axles would you need to sample if you wanted the standard deviation of the sampling distribution of x–to be 0.0005 mm? Justify your answer.
Showing 4800 - 4900
of 6217
First
42
43
44
45
46
47
48
49
50
51
52
53
54
55
56
Last
Step by Step Answers