New Semester
Started
Get
50% OFF
Study Help!
--h --m --s
Claim Now
Question Answers
Textbooks
Find textbooks, questions and answers
Oops, something went wrong!
Change your search query and then try again
S
Books
FREE
Study Help
Expert Questions
Accounting
General Management
Mathematics
Finance
Organizational Behaviour
Law
Physics
Operating System
Management Leadership
Sociology
Programming
Marketing
Database
Computer Network
Economics
Textbooks Solutions
Accounting
Managerial Accounting
Management Leadership
Cost Accounting
Statistics
Business Law
Corporate Finance
Finance
Economics
Auditing
Tutors
Online Tutors
Find a Tutor
Hire a Tutor
Become a Tutor
AI Tutor
AI Study Planner
NEW
Sell Books
Search
Search
Sign In
Register
study help
business
business statistics in practice
The Practice Of Statistics 5th Edition Daren S. Starnes, Josh Tabor - Solutions
Does fast driving waste fuel? How does the fuel consumption of a car change as its speed increases? Here are data for a British Ford Escort. Speed is measured in kilometers per hour, and fuel consumption is measured in liters of gasoline used per 100 kilometers traveled.7 Speed(km/h)Fuel
Do heavier people burn more energy? Metabolic rate, the rate at which the body consumes energy, is important in studies of weight gain, dieting, and exercise.We have data on the lean body mass and resting metabolic rate for 12 women who are subjects in a study of dieting. Lean body mass, given in
Southern education For a long time, the South has lagged behind the rest of the United States in the performance of its schools. Efforts to improve education have reduced the gap. We wonder if the South stands out in our study of state average SAT Math scores. The figure below enhances the
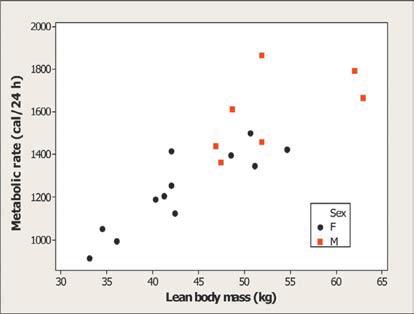
Do heavier people burn more energy? The study of dieting described in Exercise 10 collected data on the lean body mass (in kilograms) and metabolic rate (in calories) for 12 female and 7 male subjects.The figure below is a scatterplot of the data for all 19 subjects, with separate symbols for males
Merlins breeding The percent of an animal species in the wild that survives to breed again is often lower following a successful breeding season. A study of merlins (small falcons) in northern Sweden observed the number of breeding pairs in an isolated area and the percent of males (banded for
Does social rejection hurt? We often describe our emotional reaction to social rejection as “pain.” Does social rejection cause activity in areas of the brain that are known to be activated by physical pain? If it does, we really do experience social and physical pain in similar ways.
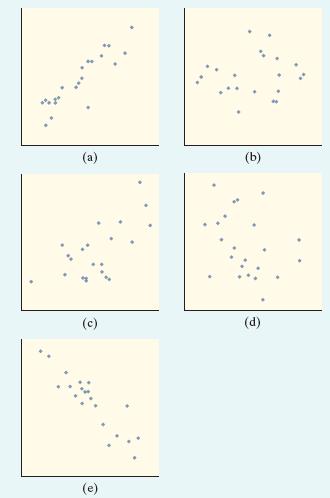
Matching correlations Match each of the following scatterplots to the r below that best describes it. (Some r’s will be left over.)r = −0.9 r = −0.7 r = −0.3 r = 0 r = 0.3 r = 0.7 r = 0.9 (b) (d)
Rank the correlations Consider each of the following relationships: the heights of fathers and the heights of their adult sons, the heights of husbands and the heights of their wives, and the heights of women at age 4 and their heights at age 18. Rank the correlations between these pairs of
Correlation blunders Each of the following statements contains an error. Explain what’s wrong in each case.(a) “There is a high correlation between the gender of American workers and their income.”(b) “We found a high correlation (r = 1.09) between students’ ratings of faculty teaching
Teaching and research A college newspaper interviews a psychologist about student ratings of the teaching of faculty members. The psychologist says,“The evidence indicates that the correlation between the research productivity and teaching rating of faculty members is close to zero.” The paper
Dem bones Archaeopteryx is an extinct beast having feathers like a bird but teeth and a long bony tail like a reptile. Only six fossil specimens are known.Because these specimens differ greatly in size, some scientists think they are different species rather than individuals from the same species.
Data on dating A student wonders if tall women tend to date taller men than do short women. She measures herself, her dormitory roommate, and the women in the adjoining rooms. Then she measures the next man each woman dates. Here are the data (heights in inches):Women (x ): 66 64 66 65 70 65 Men (y
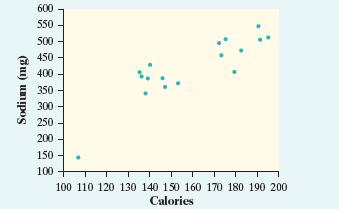
Hot dogs Are hot dogs that are high in calories also high in salt? The figure below is a scatterplot of the calories and salt content (measured as milligrams of sodium) in 17 brands of meat hot dogs.11a) The correlation for these data is r = 0.87. Explain what this value means.pg 152 (b) What
All brawn? The figure below plots the average brain weight in grams versus average body weight in kilograms for 96 species of mammals.12 There are many small mammals whose points overlap at the lower left.(a) The correlation between body weight and brain weight is r = 0.86. Explain what this value
Dem bones Refer to Exercise 19.(a) How would r change if the bones had been measured in millimeters instead of centimeters? (There are 10 millimeters in a centimeter.)(b) If the x and y variables are reversed, how would the correlation change? Explain.
Data on dating Refer to Exercise 20.(a) How would r change if all the men were 6 inches shorter than the heights given in the table? Does the correlation tell us if women tend to date men taller than themselves?(b) If heights were measured in centimeters rather than inches, how would the
Strong association but no correlation The gas mileage of an automobile first increases and then decreases as the speed increases. Suppose that this relationship is very regular, as shown by the following data on speed (miles per hour) and mileage (miles per gallon).Speed: 20 30 40 50 60 Mileage: 24
What affects correlation? Here are some hypothetical data:x: 1 2 3 4 10 10 y: 1 3 3 5 1 11(a) Make a scatterplot to show the relationship between x and y.(b) Calculate the correlation for these data by hand or using technology.(c) What is responsible for reducing the correlation to the value in
You have data for many years on the average price of a barrel of oil and the average retail price of a gallon of unleaded regular gasoline. If you want to see how well the price of oil predicts the price of gas, then you should make a scatterplot with ______ as the explanatory variable.(a) the
In a scatterplot of the average price of a barrel of oil and the average retail price of a gallon of gas, you expect to see(a) very little association.(b) a weak negative association.(c) a strong negative association.(d) a weak positive association.(e) a strong positive association.
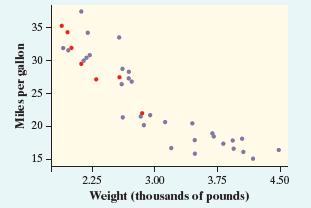
The following graph plots the gas mileage (miles per gallon) of various cars from the same model year versus the weight of these cars in thousands of pounds.The points marked with red dots correspond to cars made in Japan. From this plot, we may conclude that(a) there is a positive association
If women always married men who were 2 years older than themselves, what would the correlation between the ages of husband and wife be?(a) 2(b) 1(c) 0.5(d) 0(e) Can’t tell without seeing the data
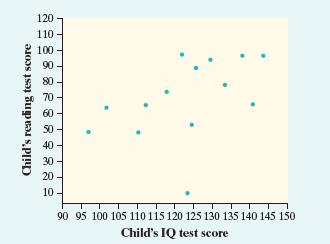
The figure below is a scatterplot of reading test scores against IQ test scores for 14 fifth-grade children.There is one low outlier in the plot. What effect does this low outlier have on the correlation?(a) It makes the correlation closer to 1.(b) It makes the correlation closer to 0 but still
If we leave out the low outlier, the correlation for the remaining 13 points in the preceding figure is closest to(a) −0.95. (c) 0. (e) 0.95.(b) −0.5. (d) 0.5.
Big diamonds (1.2, 1.3) Here are the weights (in milligrams) of 58 diamonds from a nodule carried up to the earth’s surface in surrounding rock. These data represent a population of diamonds formed in a single event deep in the earth.13 13.8 3.7 33.8 11.8 27.0 18.9 19.3 20.8 25.4 23.1 7.8 10.9
College debt (2.2) A report published by the Federal Reserve Bank of New York in 2012 reported the results of a nationwide study of college student debt.Researchers found that the average student loan balance per borrower is $23,300. They also reported that about one-quarter of borrowers owe more
Interpret the slope and y intercept of a least-squares regression line.
Use the least-squares regression line to predict y for a given x. Explain the dangers of extrapolation.
Calculate and interpret residuals.
Explain the concept of least squares.
Determine the equation of a least-squares regression line using technology or computer output.
Construct and interpret residual plots to assess whether a linear model is appropriate.
Interpret the standard deviation of the residuals and r 2 and use these values to assess how well the least-squares regression line models the relationship between two variables.
Describe how the slope, y intercept, standard deviation of the residuals, and r 2 are influenced by outliers.
Find the slope and y intercept of the least-squares regression line from the means and standard deviations of x and y and their correlation.
What’s my line? You use the same bar of soap to shower each morning. The bar weighs 80 grams when it is new. Its weight goes down by 6 grams per day on average. What is the equation of the regression line for predicting weight from days of use?
What’s my line? An eccentric professor believes that a child with IQ 100 should have a reading test score of 50 and predicts that reading score should increase by 1 point for every additional point of IQ. What is the equation of the professor’s regression line for predicting reading score from
Gas mileage We expect a car’s highway gas mileage to be related to its city gas mileage. Data for all 1198 vehicles in the government’s recent Fuel Economy Guide give the regression line: predicted highway mpg = 4.62 + 1.109 (city mpg).(a) What’s the slope of this line? Interpret this value
IQ and reading scores Data on the IQ test scores and reading test scores for a group of fifth-grade children give the following regression line: predicted reading score = −33.4 + 0.882(IQ score).(a) What’s the slope of this line? Interpret this value in context.(b) What’s the y intercept?
Acid rain Researchers studying acid rain measured the acidity of precipitation in a Colorado wilderness area for 150 consecutive weeks. Acidity is measured by pH. Lower pH values show higher acidity. The researchers observed a linear pattern over time.They reported that the regression line pH =
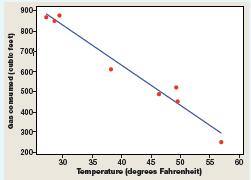
How much gas? In Exercise 4 (page 159), we examined the relationship between the average monthly temperature and the amount of natural gas consumed in Joan’s midwestern home. The figure below shows the original scatterplot with the least-squares line added. The equation of the least-squares line
Acid rain Refer to Exercise 39. Would it be appropriate to use the regression line to predict pH after 1000 months? Justify your answer.
How much gas? Refer to Exercise 40. Would it be appropriate to use the regression line to predict Joan’s natural-gas consumption in a future month with an average temperature of 65°F? Justify your answer.
Least-squares idea The table below gives a small set of data. Which of the following two lines fits the data better: y^ = 1 − x or y^ = 3 − 2x? Use the leastsquares criterion to justify your answer. (Note: Neither of these two lines is the least-squares regression line for these data.)x: −1 1
Least-squares idea In Exercise 40, the line drawn on the scatterplot is the least-squares regression line.Explain the meaning of the phrase “least-squares” to Joan, who knows very little about statistics.
Acid rain In the acid rain study of Exercise 39, the actual pH measurement for Week 50 was 5.08. Find and interpret the residual for this week.
How much gas? Refer to Exercise 40. During March, the average temperature was 46.4°F and Joan used 490 cubic feet of gas per day. Find and interpret the residual for this month.
Bird colonies Exercise 6 (page 159) examined the relationship between the number of new birds y and percent of returning birds x for 13 sparrowhawk colonies.Here are the data once again.Percent return: 74 66 81 52 73 62 52 45 62 46 60 46 38 New adults: 5 6 8 11 12 15 16 17 18 18 19 20 20(a) Use
Do heavier people burn more energy? Exercise 10 (page 160) presented data on the lean body mass and resting metabolic rate for 12 women who were subjects in a study of dieting. Lean body mass, given in kilograms, is a person’s weight leaving out all fat.Metabolic rate, in calories burned per 24
Bird colonies Refer to Exercise 47.(a) Use your calculator to make a residual plot. Describe what this graph tells you about the appropriateness of using a linear model.(b) Which point has the largest residual? Explain what this residual means in context.50. Do heavier people burn more energy?
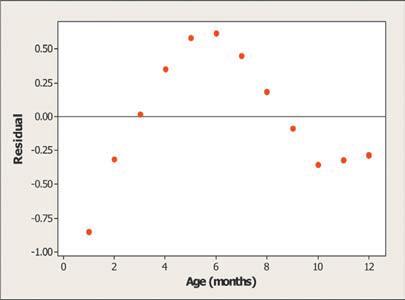
Nahya infant weights A study of nutrition in developing countries collected data from the Egyptian village of Nahya. Here are the mean weights(in kilograms)for 170 infants in Nahya who were weighed each month during their first year of life:Age (months): 1 2 3 4 5 6 7 8 9 10 11 12 Weight (kg): 4.3
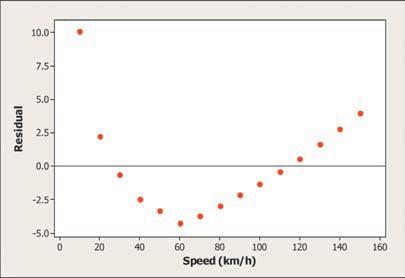
Driving speed and fuel consumption Exercise 9(page 160) gives data on the fuel consumption y of a car at various speeds x. Fuel consumption is measured in liters of gasoline per 100 kilometers driven and speed is measured in kilometers per hour.A statistical software package gives the least-squares
Oil and residuals The Trans-Alaska Oil Pipeline is a tube that is formed from 1/2-inch-thick steel and that carries oil across 800 miles of sensitive arctic and subarctic terrain. The pipe segments and the welds that join them were carefully examined before installation.How accurate are field
Oil and residuals Refer to Exercise 53. The following figure shows a residual plot for the least-squares regression line. Discuss what the residual plot tells you about the appropriateness of using a linear model. Residual of field measurement 30 30 20- 20 10- 0 -10- -20- -30 0 20 40 60 80
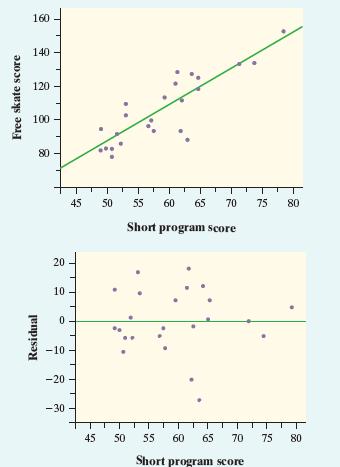
Olympic figure skating For many people, the women’s figure skating competition is the highlight of the Olympic Winter Games. Scores in the short program x and scores in the free skate y were recorded for each of the 24 skaters who competed in both rounds during the 2010 Winter Olympics in
Age and height A random sample of 195 students was selected from the United Kingdom using the CensusAtSchool data selector. The age (in years) x and height (in centimeters) y was recorded for each of the students. A regression analysis was performed using these data. The scatterplot and residual
Bird colonies Refer to Exercises 47 and 49. For the regression you performed earlier, r2 = 0.56 and s = 3.67.Explain what each of these values means in this setting.
Do heavier people burn more energy? Refer to Exercises 48 and 50. For the regression you performed earlier, r2 = 0.768 and s = 95.08. Explain what each of these values means in this setting.
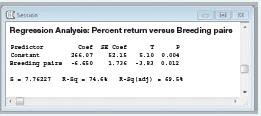
Merlins breeding Exercise 13 (page 160) gives data on the number of breeding pairs of merlins in an isolated area in each of seven years and the percent of males who returned the next year. The data show that the percent returning is lower after successful breeding seasons and that the relationship
Does social rejection hurt? Exercise 14 (page 161)gives data from a study that shows that social exclusion causes “real pain.” That is, activity in an area of the brain that responds to physical pain goes up as distress from social exclusion goes up. A scatterplot shows a moderately strong,
Husbands and wives The mean height of married American women in their early twenties is 64.5 inches and the standard deviation is 2.5 inches. The mean height of married men the same age is 68.5 inches, with standard deviation 2.7 inches. The correlation between the heights of husbands and wives is
The stock market Some people think that the behavior of the stock market in January predicts its behavior for the rest of the year. Take the explanatory variable x to be the percent change in a stock market index in January and the response variable y to be the change in the index for the entire
Husbands and wives Refer to Exercise 61.(a) Find r2 and interpret this value in context.(b) For these data, s = 1.2. Interpret this value.
The stock market Refer to Exercise 62.(a) Find r2 and interpret this value in context.(b) For these data, s = 8.3. Interpret this value.
Will I bomb the final? We expect that students who do well on the midterm exam in a course will usually also do well on the final exam. Gary Smith of Pomona College looked at the exam scores of all 346 students who took his statistics class over a 10-year period.22 Assume that both the midterm and
It’s still early We expect that a baseball player who has a high batting average in the first month of the season will also have a high batting average the rest of the season. Using 66 Major League Baseball players from the 2010 season,23 a least-squares regression line was calculated to predict
Beavers and beetles Do beavers benefit beetles?Researchers laid out 23 circular plots, each 4 meters in diameter, in an area where beavers were cutting down cottonwood trees. In each plot, they counted the number of stumps from trees cut by beavers and the number of clusters of beetle larvae.
Fat and calories The number of calories in a food item depends on many factors, including the amount of fat in the item. The data below show the amount of fat (in grams) and the number of calories in 7 beef sandwiches at McDonalds.25 Sandwich Fat Calories Big Mac® 29 550 Quarter Pounder® with
Managing diabetes People with diabetes measure their fasting plasma glucose (FPG; measured in units of milligrams per milliliter) after fasting for at least 8 hours. Another measurement, made at regular medical checkups, is called HbA. This is roughly the percent of red blood cells that have a
Rushing for points What is the relationship between rushing yards and points scored in the 2011 National Football League? The table below gives the number of rushing yards and the number of points scored for each of the 16 games played by the 2011 Jacksonville Jaguars.26 Game Rushing yards Points
Which of the following is not a characteristic of the least-squares regression line?(a) The slope of the least-squares regression line is always between −1 and 1.(b) The least-squares regression line always goes through the point (x–, y–).(c) The least-squares regression line minimizes the
Each year, students in an elementary school take a standardized math test at the end of the school year.For a class of fourth-graders, the average score was 55.1 with a standard deviation of 12.3. In the third grade, these same students had an average score of 61.7 with a standard deviation of
Using data from the 2009 LPGA tour, a regression analysis was performed using x = average driving distance and y = scoring average. Using the output from the regression analysis shown below, determine the equation of the least-squares regression line.Predictor Coef SE Coef T P Constant 87.974 2.391
By looking at the equation of the least-squares regression line, you can see that the correlation between height and arm span is(a) greater than zero.(b) less than zero.(c) 0.93.(d) 6.4.(e) Can’t tell without seeing the data.
In addition to the regression line, the report on the Mumbai measurements says that r2 = 0.95. This suggests that(a) although arm span and height are correlated, arm span does not predict height very accurately.(b) height increases by !0.95 = 0.97 cm for each additional centimeter of arm span.(c)
One child in the Mumbai study had height 59 cm and arm span 60 cm. This child’s residual is(a) −3.2 cm. (c) −1.3 cm. (e) 62.2 cm.(b) −2.2 cm. (d) 3.2 cm.
Suppose that a tall child with arm span 120 cm and height 118 cm was added to the sample used in this study. What effect will adding this child have on the correlation and the slope of the least-squares regression line?(a) Correlation will increase, slope will increase.(b) Correlation will
Suppose that the measurements of arm span and height were converted from centimeters to meters by dividing each measurement by 100. How will this conversion affect the values of r2 and s?(a) r2 will increase, s will increase.(b) r2 will increase, s will stay the same.(c) r2 will increase, s will
In my Chevrolet (2.2) The Chevrolet Malibu with a four-cylinder engine has a combined gas mileage of 25 mpg. What percent of all vehicles have worse gas mileage than the Malibu?
The top 10% (2.2) How high must a vehicle’s gas mileage be in order to fall in the top 10% of all vehicles? (The distribution omits a few high outliers, mainly hybrid gas-electric vehicles.)
Marijuana and traffic accidents (1.1) Researchers in New Zealand interviewed 907 drivers at age 21.They had data on traffic accidents and they asked the drivers about marijuana use. Here are data on the numbers of accidents caused by these drivers at age 19, broken down by marijuana use at the same
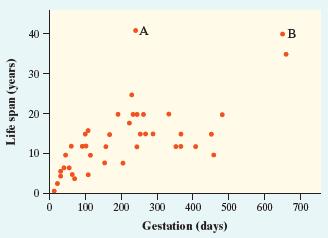
Born to be old? Is there a relationship between the gestational period (time from conception to birth)of an animal and its average life span? The figure shows a scatterplot of the gestational period and average life span for 43 species of animals.30(a) Describe the association shown in the
Penguins diving A study of king penguins looked for a relationship between how deep the penguins dive to seek food and how long they stay under water.31 For all but the shallowest dives, there is a linear relationship that is different for different penguins.The study gives a scatterplot for one
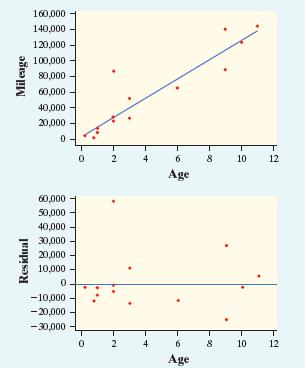
Stats teachers’ cars A random sample of AP® Statistics teachers was asked to report the age (in years)and mileage of their primary vehicles. A scatterplot of the data, a least-squares regression printout, and a residual plot are provided below.Predictor Coef SE Coef T P Constant 3704 8268 0.45
Late bloomers? Japanese cherry trees tend to blossom early when spring weather is warm and later when spring weather is cool. Here are some data on the average March temperature (in °C) and the day in April when the first cherry blossom appeared over a 24-year period:32 Temperature (°C): 4.0 5.4
What’s my grade? In Professor Friedman’s economics course, the correlation between the students’ total scores prior to the final examination and their finalexamination scores is r = 0.6. The pre-exam totals for all students in the course have mean 280 and standard deviation 30. The final-exam
Calculating achievement The principal of a high school read a study that reported a high correlation between the number of calculators owned by high school students and their math achievement. Based on this study, he decides to buy each student at his school two calculators, hoping to improve their
A school guidance counselor examines the number of extracurricular activities that students do and their grade point average. The guidance counselor says,“The evidence indicates that the correlation between the number of extracurricular activities a student participates in and his or her grade
The British government conducts regular surveys of household spending. The average weekly household spending (in pounds) on tobacco products and alcoholic beverages for each of 11 regions in Great Britain was recorded. A scatterplot of spending on alcohol versus spending on tobacco is shown
The fraction of the variation in the values of y that is explained by the least-squares regression of y on x is(a) the correlation.(b) the slope of the least-squares regression line.(c) the square of the correlation coefficient.(d) the intercept of the least-squares regression line.(e) the residual.
An AP® Statistics student designs an experiment to see whether today’s high school students are becoming too calculator-dependent. She prepares two quizzes, both of which contain 40 questions that are best done using paper-and-pencil methods. A random sample of 30 students participates in the
What was the activity level rating for the fish at a temperature of 20°C?(a) 87 (b) 84 (c) 81 (d) 66 (e) 3
Which of the following gives a correct interpretation of s in this setting?(a) For every 1°C increase in temperature, fish activity is predicted to increase by 4.785 units.(b) The typical distance of the temperature readings from their mean is about 4.785°C.(c) The typical distance of the
Which of the following statements is not true of the correlation r between the lengths in inches and weights in pounds of a sample of brook trout?(a) r must take a value between −1 and 1.(b) r is measured in inches.(c) If longer trout tend to also be heavier, then r > 0.(d) r would not change if
When we standardize the values of a variable, the distribution of standardized values has mean 0 and standard deviation 1. Suppose we measure two variables X and Y on each of several subjects. We standardize both variables and then compute the least-squares regression line. Suppose the slope of the
There is a linear relationship between the number of chirps made by the striped ground cricket and the air temperature. A least-squares fit of some data collected by a biologist gives the model y^ = 25.2 + 3.3x, where x is the number of chirps per minute and y^is the estimated temperature in
A data set included the number of people per television set and the number of people per physician for 40 countries. The Fathom screen shot below displays a scatterplot of the data with the least-squares regression line added. In Ethiopia, there were 503 people per TV and 36,660 people per doctor.
Sarah’s parents are concerned that she seems short for her age. Their doctor has the following record of Sarah’s height:Age (months): 36 48 51 54 57 60 Height (cm): 86 90 91 93 94 95(a) Make a scatterplot of these data.(b) Using your calculator, find the equation of the leastsquares regression
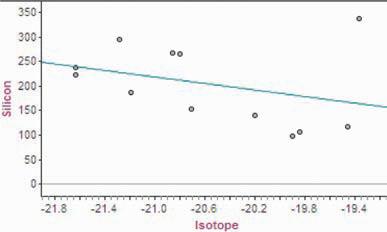
Drilling down beneath a lake in Alaska yields chemical evidence of past changes in climate. Biological silicon, left by the skeletons of single-celled creatures called diatoms, is a measure of the abundance of life in the lake. A rather complex variable based on the ratio of certain isotopes
Long-term records from the Serengeti National Park in Tanzania show interesting ecological relationships.When wildebeest are more abundant, they graze the grass more heavily, so there are fewer fires and more trees grow. Lions feed more successfully when there are more trees, so the lion population
Showing 4300 - 4400
of 6217
First
37
38
39
40
41
42
43
44
45
46
47
48
49
50
51
Last
Step by Step Answers