New Semester
Started
Get
50% OFF
Study Help!
--h --m --s
Claim Now
Question Answers
Textbooks
Find textbooks, questions and answers
Oops, something went wrong!
Change your search query and then try again
S
Books
FREE
Study Help
Expert Questions
Accounting
General Management
Mathematics
Finance
Organizational Behaviour
Law
Physics
Operating System
Management Leadership
Sociology
Programming
Marketing
Database
Computer Network
Economics
Textbooks Solutions
Accounting
Managerial Accounting
Management Leadership
Cost Accounting
Statistics
Business Law
Corporate Finance
Finance
Economics
Auditing
Tutors
Online Tutors
Find a Tutor
Hire a Tutor
Become a Tutor
AI Tutor
AI Study Planner
NEW
Sell Books
Search
Search
Sign In
Register
study help
business
business statistics using excel
Stats Modeling The World 4th Edition David Bock, Paul Velleman, Richard De Veaux - Solutions
Stereograms Stereograms appear to be composed entirely of random dots. However, they contain separate images that a viewer can “fuse” into a three-dimensional(3D) image by staring at the dots while defocusing the eyes. An experiment was performed to determine whether knowledge of the embedded
Rainmakers again The table lists the amount of rainfall(in acre-feet) from the 26 clouds seeded with silver iodide discussed in Exercise 32:a) Why is acre-feet a good way to measure the amount of precipitation produced by cloud seeding?b) Plot these data, and describe the distribution.c) Create a
Assets again Here are the same data you saw in Exercise 37 after re-expressions as the square root of assets and the logarithm of assets:
Music library Students were asked how many songs they had in their digital music libraries. Here’s a display of the responses:a) What aspect of this distribution makes it difficult to summarize, or to discuss, center and spread?b) What would you suggest doing with these data if we want to
Assets Here is a histogram of the assets (in millions of dollars) of 79 companies chosen from the Forbes list of the nation’s top corporations:a) What aspect of this distribution makes it difficult to summarize, or to discuss, center and spread?b) What would you suggest doing with these data if
Drunk driving 2008 Accidents involving drunk drivers account for about 40% of all deaths on the nation’s highways. The table below tracks the number of alcoholrelated fatalities for 26 years. (www.alcoholalert.com)a) Create a stem-and-leaf display or a histogram of these data.b) Create a
Fruit flies Researchers tracked a population of 1,203,646 fruit flies, counting how many died each day for 171 days. Here are three timeplots offering different views of these data. One shows the number of flies alive on each day, one the number who died that day, and the third the mortality
Baseball 2011 American League baseball teams play their games with the designated hitter rule, meaning that pitchers do not bat. The League believes that replacing the pitcher, typically a weak hitter, with another player in the batting order produces more runs and generates more interest among
MPG A consumer organization wants to compare gas mileage figures for several models of cars made in the United States with autos manufactured in other countries.The data for a random sample of cars classified as “midsize” are shown in the table.a) Create graphical displays for these two
Industrial experiment Engineers at a computer production plant tested two methods for accuracy in drilling holes into a PC board. They tested how fast they could set the drilling machine by running 10 boards at each of two different speeds. To assess the results, they measured the distance (in
Rainmakers? In an experiment to determine whether seeding clouds with silver iodide increases rainfall, 52 clouds were randomly assigned to be seeded or not. The amount of rain they generated was then measured (in acre-feet). Here are the summary statistics:a) Which of the summary statistics are
Reading scores A class of fourth graders takes a diagnostic reading test, and the scores are reported by reading grade level. The 5-number summaries for the 14 boys and 11 girls are shown:a) Which group had the highest score?b) Which group had the greater range?c) Which group had the greater
Cholesterol The Framingham Heart Study recorded the cholesterol levels of more than 1400 men. Here is an ogive of the distribution of these cholesterol measures.(An ogive shows the percentage of cases at or below a certain value.) Construct a boxplot for these data, and write a few sentences
Derby speeds 2011 How fast do horses run? Kentucky Derby winners top 30 miles per hour, as shown in this graph. The graph shows the percentage of Derby winners that have run slower than each given speed. Note that few have won running less than 33 miles per hour, but about 86% of the winning horses
SAT scores Here are the summary statistics for Verbal SAT scores for a high school graduating class:a) Create parallel boxplots comparing the scores of boys and girls as best you can from the information given.b) Write a brief report on these results. Be sure to discuss the shape, center, and
Caffeine A student study of the effects of caffeine asked volunteers to take a memory test 2 hours after drinking soda. Some drank caffeine-free cola, some drank regular cola (with caffeine), and others drank a mixture of the two (getting a half-dose of caffeine). Here are the
Eye and hair color A survey of 1021 school-age children was conducted by randomly selecting children from several large urban elementary schools. Two of the questions concerned eye and hair color. In the survey, the following codes were used:The Statistics students analyzing the data were asked to
Test scores Three Statistics classes all took the same test.Histograms and boxplots of the scores for each class are shown below. Match each class with the corresponding boxplot.
Load factors by year Here is a display of the load factors (passenger-miles as a percentage of available seat-miles) for domestic airline flights by year. Describe the patterns you see.
Load factors by month The Research and Innovative Technology Administration of the Bureau of Transportation Statistics (www.TranStats.bts.gov) reports load factors (passenger-miles as a percentage of available seatmiles) for commercial airlines for every month from 2000 through 2011. Here is a
Ozone Ozone levels (in parts per billion, ppb) were recorded at sites in New Jersey monthly between 1926 and 1971. Here are boxplots of the data for each month (over the 46 years), lined up in order (January = 1):a) In what month was the highest ozone level ever recorded?b) Which month has the
Fuel economy 2012 The Environmental Protection Agency provides fuel economy and pollution information on over 2000 car models. Here are boxplots of Combined Fuel Economy (using an average of driving conditions)in miles per gallon by vehicle Type (midsize car, standard pickup truck, or SUV) for 2012
Fuel economy Describe what these boxplots tell you about the relationship between the number of cylinders a car’s engine has and the car’s fuel economy (mpg):
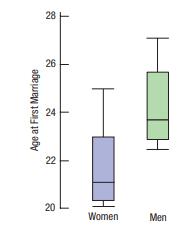
Marriage age In 1975, did men and women marry at the same age? Here are boxplots of the age at first marriage for a sample of U.S. citizens then. Write a brief report discussing what these data show. 28 28 26 24 24 Age at First Marriage 22 20 20 Women Men
Women’s basketball Here are boxplots of the points scored during the first 10 games of the season for both Scyrine and Alexandra:a) Compare the distribution of prices over the three years.b) In which year were the prices least stable? Explain.
Deaths 2009 A National Vital Statistics Report (www.cdc.gov/nchs/) indicated that nearly 290,000 black Americans died in 2009, compared with just over 2 million white Americans. Here are histograms displaying the distributions of their ages at death:a) Describe the overall shapes of these
Hospital stays The U.S. National Center for Health Statistics compiles data on the length of stay by patients in short-term hospitals and publishes its findings in Vital and Health Statistics. Data from a sample of 39 male patients and 35 female patients on length of stay (in days) are displayed in
Home Runs 2012 Here is a “back-to-back” stemplot that shows two data sets at once—one going to the left, one to the right. The display compares the number of home runs for Major League Baseball teams in the National League and the American League during the 2012 season.a) Use the data in the
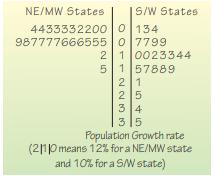
Population growth 2010 This “back-to-back” stem-andleaf plot displays two data sets at once—one going to the left, one to the right. The plot compares the percent change in population for two regions of the United States (based on census figures for 2000 and 2010). The fastest growing state
Tendon transfers People with spinal cord injuries may lose function in some, but not all, of their muscles. The ability to push oneself up is particularly important for shifting position when seated and for transferring into and out of wheelchairs. Surgeons compared two operations to restore the
Cereals Sugar is a major ingredient in many breakfast cereals. The histogram displays the sugar content as a percentage of weight for 49 brands of cereal. The boxplot compares sugar content for adult and children’s cereals.
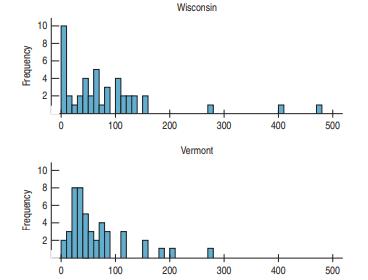
Camping Here are summary statistics and histograms for the number of campsites at public parks in Wisconsin and Vermont. Write a few sentences comparing the numbers of campsites in these two states. Be sure to talk about shape (including outliers), center, and spread. 10 0 + Frequency 2 Wisconsin
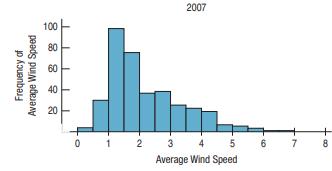
Hopkins 2007 Below are histograms and the five-number summaries for the average windspeeds in the Hopkins forest for the year 2007 and the year 2011, which was discussed in the chapter. Compare these distributions, and be sure to address shape (including outliers if there are any), center, and
Costs To help travelers know what to expect, researchers collected the prices of commodities in 16 cities throughout the world. Here are boxplots comparing the prices of a ride on public transportation, a newspaper, and a cup of coffee in the 16 cities (prices are all in $US).a) On average, which
Pizza prices A company that sells frozen pizza to stores in four markets in the United States (Denver, Baltimore, Dallas, and Chicago) wants to examine the prices that the stores charge for pizza slices. Here are boxplots comparing data from a sample of stores in each market:
Groups on the Internet Find data on the Internet (or elsewhere) for two or more groups. Make appropriate displays to compare the groups, and interpret what you find.
Time on the Internet Find data on the Internet (or elsewhere) that give results recorded over time. Make an appropriate display and discuss what it shows.
In the news Find an article in a newspaper, magazine, or the Internet that shows a time plot.a) Does the article discuss the W’s?b) Is the timeplot appropriate for the data? Explain.c) Discuss what the timeplot reveals about the variable.d) Does the article accurately describe and interpret the
In the news Find an article in a newspaper, magazine, or the Internet that compares two or more groups of data.a) Does the article discuss the W’s?b) Is the chosen display appropriate? Explain.c) Discuss what the display reveals about the groups.d) Does the article accurately describe and
Prisons 2006 A report from the U.S. Department of Justice (www.ojp.usdoj.gov/bjs/) reported the percent changes in federal prison populations in 21 northeastern and midwestern states during 2006. Using appropriate graphical displays and summary statistics, write a report on the changes in prison
Population growth The following data show the percentage change in population for the 50 states and the District of Columbia from 2000 to 2009. Using appropriate graphical displays and summary statistics, write a report on the percentage change in population by state.
Boomtowns 2011 In 2011, the website NewGeography.com listed its ranking of the best cities for job growth in the United States. Here are the magazine’s top 20 larger cites, along with their weighted job rating indices.a) Make a suitable display of the job rating indices.b) Summarize the typical
Math scores 2009 The National Center for Education Statistics (http://nces.ed.gov/nationsreportcard/) reported 2009 average mathematics achievement scores for eighth graders in all 50 states:a) Find the median, the IQR, the mean, and the standard deviation of these state averages.b) Which summary
Zip codes revisited Here are some summary statistics to go with the histogram of the zip codes of 500 customers from the Holes-R-Us Internet Jewelry Salon that we saw in Exercise 53:What can these statistics tell you about the company’s sales?
Zip codes Holes-R-Us, an Internet company that sells piercing jewelry, keeps transaction records on its sales.At a recent sales meeting, one of the staff presented a histogram of the zip codes of the last 500 customers, so that the staff might understand where sales are coming from. Comment on the
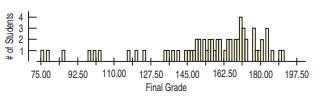
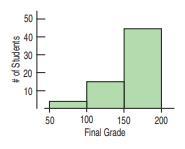
Final grades revisited After receiving many complaints about his final-grade histogram from students currently taking a Statistics course, the professor from Exercise 51 distributed the following revised histogram:a) Comment on this display.b) Describe the distribution of grades. squares # 4329 *
Final grades A professor (of something other than Statistics!) distributed the following histogram to show the distribution of grades on his 200-point final exam.Comment on the display. # of Students 50 40 30 20 10 88 50 50 100 150 200 Final Grade
Marijuana 2007 In 2007 the Council of Europe published a report entitled The European School Survey Project on Alcohol and Other Drugs (www.espad.org).Among other issues, the survey investigated the percentages of 16-year-olds who had used marijuana. Shown on the next page are the results for 34
Acid rain Two researchers measured the pH(a scale on which a value of 7 is neutral and values below 7 are acidic) of water collected from rain and snow over a 6-month period in Allegheny County, PA. Describe their data with a graph and a few sentences:
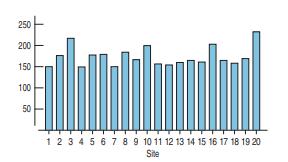
One student submitted the following display:a) Comment on this graph.b) Create your own histogram of the data. 250 200 150 100 50 1 2 3 4 5 6 7 8 9 10 11 12 13 14 15 16 17 18 19 20 Site
Return of the birds Students were given the assignment to make a histogram of the data on bird counts reported in Exercise
A-Rod 2010 again Students were asked to make a histogram of the number of home runs hit by Alex Rodriguez from 1995 to 2010 (see Exercise 43). One student submitted the following display:a) Comment on this graph.b) Create your own histogram of the data.
Horsepower Create a stem-and-leaf display for these horsepowers of autos reviewed by Consumer Reports one year, and describe the distribution:
Hurricanes 2010 The data below give the number of hurricanes classified as major hurricanes in the Atlantic Ocean each year from 1944 through 2006, as reported by NOAA (www.nhc.noaa.gov):a) Create a dotplot of these data.b) Describe the distribution.
Bird species 2010 The Cornell Lab of Ornithology holds an annual Christmas Bird Count (www.birdsource.org), in which bird watchers at various locations around the country see how many different species of birds they can spot. Here are some of the counts reported from sites in Texas during the 2010
A-Rod 2010 Alex Rodriguez (known to fans as A-Rod)was the youngest player ever to hit 500 home runs. Here is a stem-and-leaf display of the number of home runs hit by “A-Rod” during the 1994–2010 seasons (www.baseballreference.com/players/r/rodrial01.shtml.).Describe the distribution,
Wayne Gretzky In Exercise 40, you examined the number of games played by hockey great Wayne Gretzky during his 20-year career in the NHL.a) Would you use the median or the mean to describe the center of this distribution? Why?
States The stem-and-leaf display shows populations of the 50 states and Washington, DC, in millions of people, according to the 2000 census.a) What measures of center and spread are most appropriate?b) Without doing any calculations, which must be larger:the median or the mean? Explain how you
The Great One During his 20 seasons in the NHL, Wayne Gretzky scored 50% more points than anyone who ever played professional hockey. He accomplished this amazing feat while playing in 280 fewer games than Gordie Howe, the previous record holder. Here are the number of games Gretzky played during
Gasoline 2011 In October 2011, 16 gas stations in eastern Wisconsin, posted these prices for a gallon of regular gasoline:a) Make a stem-and-leaf display of these gas prices.Use split stems; for example, use two 3.3 stems—one for prices between $3.30 and $3.34 and the other for prices from $3.35
Singers The frequency table shows the heights (in inches)of 130 members of a choir.a) Find the median and IQR.b) Find the mean and standard deviation.c) Display these data with a histogram.d) Write a few sentences describing the distribution.
Payroll A small warehouse employs a supervisor at $1200 a week, an inventory manager at $700 a week, six stock boys at $400 a week, and four drivers at $500 a week.a) Find the mean and median wage.b) How many employees earn more than the mean wage?c) Which measure of center best describes a typical
Sick days During contract negotiations, a company seeks to change the number of sick days employees may take, saying that the annual “average” is 7 days of absence per employee.The union negotiators counter that the “average” employee misses only 3 days of work each year. Explain how both
Movie earnings The histogram shows total gross earnings(in millions of dollars) of major release movies in 2011.An industry publication reports that the average movie makes $41.7 million, but a watchdog group concerned with rising ticket prices says that the average earnings is $66.9 million. What
Cold weather A meteorologist preparing a talk about global warming compiled a list of weekly low temperatures (in degrees Fahrenheit) he observed at his southern Florida home last year. The coldest temperature for any week was 36°F, but he inadvertently recorded the Celsius value of 2°. Assuming
Mistake A clerk entering salary data into a company spreadsheet accidentally put an extra “0” in the boss’s salary, listing it as $2,000,000 instead of $200,000.Explain how this error will affect these summary statistics for the company payroll:a) measures of center: median and mean.b)
Test scores correction After entering the test scores from her Statistics class of 25 students, the instructor calculated some statistics of the scores. Upon checking, she discovered that she had entered the top score as 46, but it should have been 56.a) When she corrects this score, how will the
Fuel Economy The boxplot shows the fuel economy ratings for 67 model year 2012 subcompact cars. Some summary statistics are also provided. The extreme outlier is the Mitsubishi i-MiEV, an electric car whose electricity usage is equivalent to 112 miles per gallon.If that electric car is removed from
Golf drives II 2011 Exercise 28 looked at distances PGA golfers can hit the ball. The standard deviation of these average drive distances is 8.4 yards, and the quartiles are Q1 = 285.2 yards and Q3 = 297.5 yards.a) Write a sentence or two describing the spread in distances based on i) the
Movie lengths II Exercise 27 looked at the running times of movies released in 2011. The standard deviation of these running times is s = 17.3 minutes, and the quartiles are Q1 = 97 minutes and Q3 = 115 minutes.a) Write a sentence or two describing the spread in running times based on i) the
Golf drives 2011 The display shows the average drive distance (in yards) for 186 professional golfers on the men’s PGA tour in 2011.a) Describe this distribution.b) Approximately what proportion of professional male golfers drive, on average, less than 280 yards?c) Estimate the mean by examining
Movie lengths The histogram shows the running times in minutes of 150 top grossing films of 2011.a) You plan to see a movie this weekend. Based on these movies, how long do you expect a typical movie to run?b) Would you be surprised to find that your movie ran
Neck sizes again Look again at the histogram of men’s neck sizes in Exercise 24.a) Is the mean closer to 14, 15, or 16 inches? Why?b) Is the standard deviation closer to 1 inch, 3 inches, or 5 inches? Explain.
Pizza prices again Look again at the histogram of the pizza prices in Exercise 23.a) Is the mean closer to $2.40, $2.60, or $2.80? Why?b) Is the standard deviation closer to $0.15, $0.50, or$1.00? Explain.
Neck size The histogram shows the neck sizes (in inches)of 250 men recruited for a health study in Utah.Which summary statistics would you choose to summarize the center and spread in these data? Why?
Pizza prices The histogram shows the distribution of the prices of plain pizza slices (in $) for 156 weeks in Dallas, TX.Which summary statistics would you choose to summarize the center and spread in these data? Why?
Standard deviation II For each lettered part, a through c, examine the two given sets of numbers. Without doing any calculations, decide which set has the larger standard deviation and explain why. Then check by finding the standard deviations by hand.
Standard deviation I For each lettered part, a through c, examine the two given sets of numbers. Without doing any calculations, decide which set has the larger standard deviation and explain why. Then check by finding the standard deviations by hand.
Outliers The 5-number summary for the run times in minutes of the 150 highest grossing movies of 2010 looks like this:a) Are there any outliers in these data? How can you tell?b) Construct a boxplot. (You will be unable to mark outliers if they exist.) Based on your plot, say what you can about the
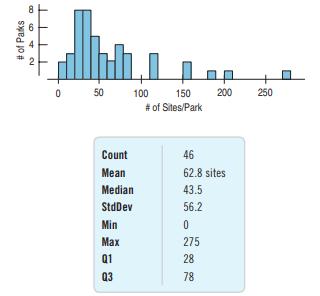
Camp sites Shown below are the histogram and summary statistics for the number of camp sites at public parks in Vermont.a) Which statistics would you use to identify the center and spread of this distribution? Why?b) How many parks would you classify as outliers? Explain.c) Create a boxplot for
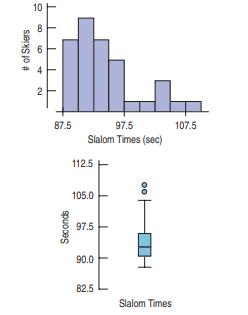
Slalom times The Men’s Combined skiing event consists of a downhill and a slalom. Here are two displays of the slalom times in the Men’s Combined at the 2006 Winter Olympics:a) What features of the distribution can you see in both the histogram and the boxplot?b) What features of the
Still rockin’ Crowd Management Strategies monitors accidents at rock concerts. In their database, they list the names and other variables of victims whose deaths were attributed to“crowd crush” at rock concerts. Here are the histograms and boxplot of the victims’ ages for the data from 1999
Opposites In a way, boxplots are the opposite of histograms. A histogram divides the number line into equal intervals and displays the number of data values in each interval. A boxplot divides the data into equal parts and displays the portion of the number line each part covers.These two plots
Details Here are histograms for four manufactured sets of numbers. The histograms look rather different, but all four sets have the same 5-number summary, so the boxplots for all four sets are identical to the one shown.a) Using these plots as examples, identify some features of a distribution that
Super Bowl wins In the Super Bowl, by how many points does the winning team outscore the losers?Here are the winning margins for the first 46 Super Bowl games:25, 19, 9, 16, 3, 21, 7, 17, 10, 4, 18, 17, 4, 12, 17, 5, 10, 29, 22, 36, 19, 32, 4, 45, 1, 13, 35, 17, 23, 10, 14, 7, 15, 7, 27, 3, 27, 3,
Super Bowl points How many points do football teams score in the Super Bowl? Here are the total numbers of points scored by both teams in each of the first 46 Super Bowl games:45, 47, 23, 30, 29, 27, 21, 31, 22, 38, 46, 37, 66, 50, 37, 47, 44, 47, 54, 56, 59, 52, 36, 65, 39, 61, 69, 43, 75, 44, 56,
E-mails A university teacher saved every e-mail received from students in a large Introductory Statistics class during an entire term. He then counted, for each student who had sent him at least one e-mail, how many e-mails each student had sent.1 6 11 16 21 20 40 60 80# of Students# of E-mailsa)
Heart attack stays The histogram shows the lengths of hospital stays (in days) for all the female patients admitted to hospitals in New York during one year with a primary diagnosis of acute myocardial infarction (heart attack).600 400 200# of Female Patients 0 5 10 15 20 25 30 35 40 Stay (days)a)
Run times One of the authors collected the times (in minutes) it took him to run 4 miles on various courses during a 10-year period. Here is a histogram of the times.50 40 30 20 10# of Days 28.0 29.0 30.0 31.0 32.0 33.0 34.0 35.0 4-Mile Time (min)Describe the distribution and summarize the
Vineyards The histogram shows the sizes (in acres) of 36 vineyards in the Finger Lakes region of New York.Size (acres)# of Vineyardsa) Approximately what percentage of these vineyards are under 60 acres?b) Write a brief description of this distribution (shape, center, spread, unusual features).
Singers The display shows the heights of some of the singers in a chorus, collected so that the singers could be positioned on stage with shorter ones in front and taller ones in back.a) Describe the distribution.b) Can you account for the features you see here?
Sugar in cereals The histogram displays the sugar content (as a percent of weight) of 49 brands of breakfast cereals.8 64 20 8 16 24 32 40 48 56 Sugar (%)# of Cerealsa) Describe this distribution.b) What do you think might account for this shape?
More shapes Would you expect distributions of these variables to be uniform, unimodal, or bimodal? Symmetric or skewed? Explain why.a) Ages of people at a Little League game.b) Number of siblings of people in your class.c) Pulse rates of college-age males.d) Number of times each face of a die shows
Thinking about shape Would you expect distributions of these variables to be uniform, unimodal, or bimodal?Symmetric or skewed? Explain why.a) The number of speeding tickets each student in the senior class of a college has ever had.b) Players’ scores (number of strokes) at the U.S. Open golf
In the news II Find an article in a newspaper, a magazine, or the Internet that discusses a measure of spread.a) Does the article discuss the W’s for the data?b) What are the units of the variable?c) Does the article use the range, IQR, or standard deviation?d) Is the choice of measure of spread
In the news Find an article in a newspaper, a magazine, or the Internet that discusses an “average.”a) Does the article discuss the W’s for the data?b) What are the units of the variable?c) Is the average used the median or the mean? How can you tell?d) Is the choice of median or mean
Not a histogram Find a graph other than a histogram that shows the distribution of a quantitative variable in a newspaper, a magazine, or the Internet.a) Does the article identify the W’s?b) Discuss whether the display is appropriate for the data.c) Discuss what the display reveals about the
Histogram Find a histogram that shows the distribution of a variable in a newspaper, a magazine, or the Internet.a) Does the article identify the W’s?b) Discuss whether the display is appropriate.c) Discuss what the display reveals about the variable and its distribution.d) Does the article
Be a Simpson Can you design a Simpson’s paradox? Two companies are vying for a city’s “Best Local Employer”award, to be given to the company most committed to hiring local residents. Although both employers hired 300 new people in the past year, Company A brags that it deserves the award
Graduate admissions A 1975 article in the magazine Science examined the graduate admissions process at Berkeley for evidence of sex discrimination. The table below shows the number of applicants accepted to each of four graduate programs:a) What percent of total applicants were admitted?b) Overall,
Showing 1300 - 1400
of 2900
First
7
8
9
10
11
12
13
14
15
16
17
18
19
20
21
Last
Step by Step Answers