New Semester
Started
Get
50% OFF
Study Help!
--h --m --s
Claim Now
Question Answers
Textbooks
Find textbooks, questions and answers
Oops, something went wrong!
Change your search query and then try again
S
Books
FREE
Study Help
Expert Questions
Accounting
General Management
Mathematics
Finance
Organizational Behaviour
Law
Physics
Operating System
Management Leadership
Sociology
Programming
Marketing
Database
Computer Network
Economics
Textbooks Solutions
Accounting
Managerial Accounting
Management Leadership
Cost Accounting
Statistics
Business Law
Corporate Finance
Finance
Economics
Auditing
Tutors
Online Tutors
Find a Tutor
Hire a Tutor
Become a Tutor
AI Tutor
AI Study Planner
NEW
Sell Books
Search
Search
Sign In
Register
study help
business
descriptive statistics
Edexcel As And A Level Modular Mathematics Statistics 1 1st Edition Keith Pledger Et Al - Solutions
In a survey of the earnings of some sixth form students who did Saturday jobs the median wage was 36.50. The 75th percentile was 45.75 and the interquartile range was 30.50. Use the quartiles to describe the skewness of the distribution.AppendixLO1
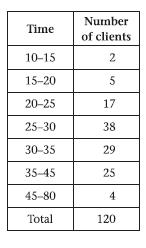
A group of estate agents recorded the time spent on the first meeting with a random sample of 120 of their clients. The times, to the nearest minute, are summarised in the table. a Calculate estimates of the mean and variance of the times. b By interpolation obtain estimates of the median and
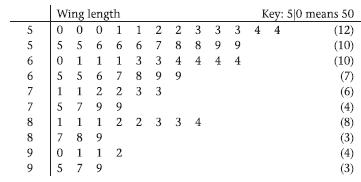
The following stem and leaf diagram summarises the wing length, to the nearest mm, of a random sample of 67 owl moths.a Write down the mode of these data. b Find the median and quartiles of these data. c On graph paper, construct a box plot to represent these data. d Comment on the skewness of the
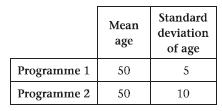
A TV company wishes to appeal to a wider range of viewers. They decide to purchase a programme from another channel. They have the option of buying one of two programmes. The company collects information. from a sample of viewers for each programme. The results are summarised in the table. State
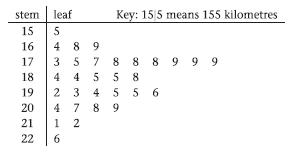
Jason and Perdita decided to go for a touring holiday on the continent for the whole of July. They recorded the number of kilometres they travelled each day. The data are summarised in the stem and leaf diagram below.a Find Q, Q, and Q3 Outliers are values that lie outside Q-1.5(Q-Q) and Q +
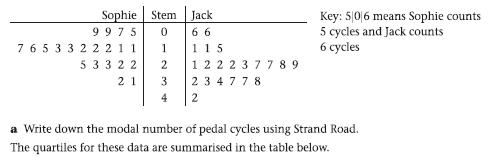
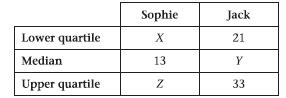
Sophie and Jack do a survey every day for three weeks. Sophie counts the number of pedal cycles using Market Street. Jack counts the number of pedal cycles using Strand Road. The data they collected are summarised in the back-to-back stem and leaf diagram.a Write down the modal number of pedal
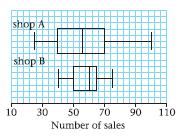
Shop A and Shop B both sell mobile phones. They recorded how many they sold each day over a long period of time. The data they collected are represented in the box plots. a Shop B says that for 50% of the days they sold 60 or more phones a day. State whether or not this is a true statement. Give a
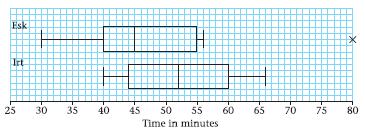
Fell runners from the Esk Club and the Irt Club were keen to see which club had the fastest runners overall. They decided that all the members from both clubs would take part in a fell run. The time each runner took to complete the run was recorded. The results are summarised in the box plot.a
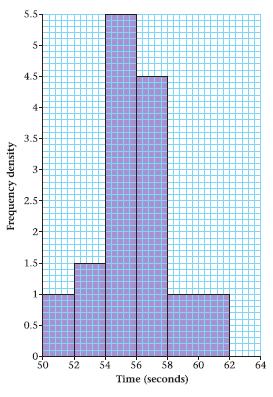
The histogram shows the time taken by a group of 58 girls to run a measured distance. a Work out the number of girls who took longer than 56 seconds. b Estimate the number of girls who took between 52 and 55 seconds.AppendixLO1 Frequency density 5.5- 5+ 4.5- 4- 3.5- 2.5 2 1.5- 1- 3- 0.5- 0+ 50 52
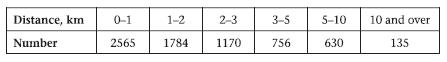
The table gives the distances travelled to school, in km, of the population of children in a particular region of the United Kingdom.A histogram of this data was drawn with distance along the horizontal axis. A bar of horizontal width 1.5 cm and height 5.7 cm represented the 0-1 km group. Find the
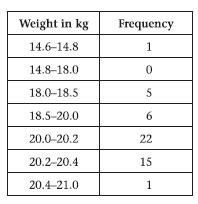
The labelling on bags of garden compost indicates that the bags weigh 20 kg. The weights of a random sample of 50 bags are summarised in the table opposite. a On graph paper, draw a histogram of these data. b Estimate the mean and standard deviation of the weight of a bag of compost. [You may use
The number of bags of potato crisps sold per day in a bar was recorded over a two-week period. The results are shown below. 20 15 10 30 33 40 5 11 13 20 25 42 31 17 a Calculate the mean of these data. b Draw a stem and leaf diagram to represent these data. c Find the median and the quartiles of
Throwing a six sided die once and recording if the number face up is odd or even. Find the probability of an even number landing face up.AppendixLO1
Tossing two coins. Find the probability of the same outcome on each coin.AppendixLO1
A card is drawn from a pack of 52 playing cards. Find the probability that the card is a heart.AppendixLO1
A card is drawn from a pack of 52 playing cards, its suit is recorded then it is replaced and another card is drawn. Find the probability of drawing a spade and a club in any order. 5 Throwing a die and tossing a coin. Find the probability of a head and a AppendixLO1
Throwing two six sided dice and recording the product of the values on the two sides that are uppermost. Find the probability of the answer being greater than or equal to 24.AppendixLO1
A card is chosen at random from a pack of 52 playing cards. C is the event 'the card chosen is a club' and K is the event 'the card chosen is a King'. Find these. a P(K) d P(CUK) b P(C) e P(C') c P(CK) f (K' nC)AppendixLO1
There are 25 students in a certain tutor group at Philips College. There are 16 students in the tutor group studying German, 14 studying French and six students studying both French and German. Find the probability that a randomly chosen student in the tutor group a studies French, b studies French
On a firing range, a rifleman has two attempts to hit a target. The probability of hitting the target with the first shot is 0.2 and the probability of hitting with the second shot is 0.3. The probability of hitting the target with both shots is 0.1. Find the probability of a missing the target
Of all the households in the UK, 40% have a plasma TV and 50% have a laptop computer. There are 25% of households that have both a plasma TV and a laptop. Find the probability that a household chosen at random has either a plasma TV or a laptop computer but not both.AppendixLO1
There are 125 diners in a restaurant who were surveyed to find out if they had ordered garlic bread, beer or cheesecake. 15 diners had ordered all three items 43 diners had ordered garlic bread 40 diners had ordered beer 44 diners had ordered cheesecake 20 had ordered beer and cheesecake 26 had
A group of 275 people at a music festival were asked if they play guitar, piano or drums. one person plays all three instruments 65 people play guitar and piano 10 people play piano and drums 30 people play guitar and drums 15 people play piano only 20 people play guitar only 35 people play drums
A and B are two events and P(A) = 0.5, P(B) = 0.2 and P(AB) = 0.1. Find a P(AUB), P(AB), b P(B), d P(A U B').AppendixLO1
A and C are two events and P(A) = 0.4, P(B) = 0.5 and P(AUB) 0.6. Find a P(AB), C P(A U B'), b P(A'), d P(A' UB).AppendixLO1
C and D are two events and P(D) = 0.4, P(CD) = 0.15 and P(C n D) = 0.1. Find a P(CD), e P(C),b. P(CD), d P(CD).AppendixLO1
There are two events T and Q where P(T) = P(Q) = 3P(TQ) and P(TUQ) = 0.75. Find a P(TQ), d P(TQ), b P(T), e P(TQ). c P(Q), AppendixLO1
A survey of all the households in the town of Bury was carried out. The survey showed that 70% have a freezer and 20% have a dishwasher and 80% have either a dishwasher or a freezer or both appliances. Find the probability that a randomly chosen household in Bury has both appliances.AppendixLO1
The probability that a child in a school has blue eyes is 0.27 and the probability they have blonde hair is 0.35. The probability that the child will have blonde hair or blue eyes or both is 0.45. A child is chosen at random from the school. Find the probability that the child has a blonde hair and
A patient going in to a doctor's waiting room reads Hiya Magazine with probability 0.6 and Dakor Magazine with probability 0.4. The probability that the patient reads either one or both of the magazines is 0.7. Find the probability that the patient reads a both magazines, b Hiya Magazine
A card is drawn at random from a pack of 52 playing cards. Given that the card is a diamond, find the probability that the card is an ace.AppendixLO1
Two coins are flipped and the results are recorded. Given that one coin lands on a head, find the probability of a two heads,b. a head and a tail.AppendixLO1
Two fair dice are thrown and the product of the numbers on the dice is recorded. Given that one die lands on 2, find the probability that the product on the dice is a exactly 6, b more than AppendixLO1
A and B are two events such that P(A) b P(B|A), a P(AUB), AppendixLO1
A and B are two events such that P(A) a P(B|A), b P(AB), AppendixLO1
Let A and B be events such that P(A) = Find a P(A|B), b P(AB), AppendixLO1
C and D are two events and P(CID) = a P(CD), b P(CD), P(A|B), 0.6, P(B) 0.5 and P(A B) -0.4, find d P(A|B'). 0.4, P(B) - 0.5 and P(A|B) 0.4, find c P(AB). P(B) = and P(AUB) = C PA'B'). P(CID) and P(D) = find c P(C), d P(DIC), e P(DIC), f P(DC).AppendixLO1
A bag contains five red and four blue tokens. A token is chosen at random, the colour recorded and the token is not replaced. A second token is chosen and the colour recorded. Find the probability that a the second token is red given the first token is blue, b the second token is blue given the
A box of 24 chocolates contains 10 dark and 14 milk chocolates. Linda chooses a chocolate at random and eats it, followed by another one. Fine the probability that Linda eats a two dark chocolates, b one dark and one milk chocolate.AppendixLO1
Jean always goes to work by bus or takes a taxi. If one day she goes to work by bus, the probability she goes to work by taxi the next day is 0.4. If one day she goes to work by taxi, the probability she goes to work by bus the next day is 0.7. Given that Jean takes the bus to work on Monday, find
Sue has two coins. One is fair, with a head on one side and a tail on the other. The second is a trick coin and has a tail on both sides. Sue picks up one of the coins at random and flips it. a Find the probability that it lands heads up. b Given that it lands tails up, find the probability that
A contestant on a quiz show is asked to choose one of three doors. Behind one of the doors is the star prize of a sports car, but behind each of the other two doors there is a toy car. The contestant chooses one of the three doors. The host then opens one of the remaining two doors and reveals a
Event A and event B are mutually exclusive and P(A) = 0.2, P(B) = 0.5. a Draw a Venn diagram to represent these two events. b Find P(AUB). c Find P(A' n B').AppendixLO1
Two events A and B are independent and P(A) and P(B) - Find a P(AB),b. P(AB), AppendixLO1
Q and R are two events such that P(Q) a the relationship between Q and R, C P(A'B'). 0.2, P(R) = 0.4 and P(QR) = 0.4. Find b P(QUR), P(QR).AppendixLO1
Two fair dice are rolled and the result on each die is recorded. Show that the event 'the sum of the scores on the dice is 4' and' both dice land on the same number' are not mutually exclusive.AppendixLO1
A bag contains three red beads and five blue beads. A bead is chosen at random from the bag, the colour is recorded and the bead is replaced. A second bead is chosen and the colour recorded. a Find the probability that both beads are blue. b Find the probability that the second bead is
A box contains 24 electrical components of which four are known to be defective. Two items are taken at random from the box. Find the probability of selecting a two defective components if the first item is replaced before choosing the second item, b two defective components if the first item is
A bag contains one red, two blue and three green tokens. One token is chosen at random, the colour is recorded and the token replaced. A second token is then chosen and the colour recorded. a Draw a tree diagram showing the possible outcomes. Find the probability of choosing b two tokens of the
Paul and Gill decide to play a board game. The probability that Paul wins the game is 0.25 and the probability that Gill wins is 0.3. They decide to play three games. Given that the results of successive games are independent, find the probability that a Paul wins three games in a row, Gill wins
The events A and B are such that P(A) = P(B) and P(AUB) - a Show that A and B are independent. b Represent these probabilities in a Venn diagram. e Find P(A|B).AppendixLO1
A computer game has three levels and one of the objectives of every level is to collect a diamond. The probability of a randomly chosen player collecting a diamond on the first level is the second level is and the third level is The events are independent. a Draw a tree diagram to represent
An online readers' club has 50 members. Glasses are worn by 15 members, 18 are left handed and 21 are female. There are four females who are left handed, three females who wear glasses and five members who wear glasses and are left handed. Only one member wears glasses, is left handed and female. a
For the events / and K, PJUK) = 0.5, PK) = 0.2, P(JK') = 0.25. a Draw a Venn diagram to represent the events / and K and the sample space S. Find b PU), c P(K), e Determine whether or not J and K are independent. A PUJ K).AppendixLO1
There are 15 coloured beads in a bag; seven beads are red, three are blue and five are green. Three beads are selected at random from the bag and not replaced. Find the probability that a the first and second beads chosen are red and the third bead is blue or green, b one red, one blue and one
A survey of a group of students revealed that 85% have a mobile phone, 60% have an MP3 player and 5% have neither phone nor MP3 player. a Find the proportion of students who have both gadgets. b Draw a Venn diagram to represent this information. Given that a randomly selected student has a phone or
In a factory, machines A, B and C produce electronic components. Machine A produces 16% of the components, machine B produces 50% of the components and machine C produces the rest. Some of the components are defective. Machine A produces 4%, machine B 3% and machine C 7% defective components. a
A garage sells three types of fuel; U95, U98 and diesel. In a survey of 200 motorists buying fuel at the garage, 80 are female and the rest are male. Of the 90 motorists buying 'U95' fuel, 50 were female and of the 70 motorists buying diesel, 60 were male. A motorist does not buy more than one type
A study was made of a group of 150 children to determine which of three cartoons they watch on television. The following results were obtained: 35 watch Toontime 54 watch Porky 62 watch Skellingtons 9 watch Toontime and Porky 14 watch Porky and Skellingtons 12 watch Toontime and Skellingtons 4
The members of a wine tasting club are married couples. For any married couple in the club, the probability that the husband is retired is 0.7 and the probability that the wife is retired 0.4. Given that the wife is retired, the probability that the husband is retired is 0.8. For a randomly chosen
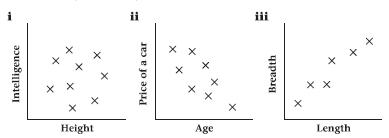
The following scatter diagrams were drawn.a. Describe the type of correlation shown by each scatter diagram. b Interpret each correlation.AppendixLO1 Intelligence Height + x Price of a car x X Age x Breadth Length X X x x
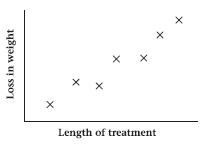
Some research was done into the effectiveness of a weight reducing drug. Seven people recorded their weight loss and this was compared with the length of time for which they had been treated. A scatter diagram was drawn to represent these data. a Describe the type of correlation shown by the
Eight metal ingots were chosen at random and measurements were made of their breaking strength (x) and their hardness (y). The results are shown in the table below. x (tonne/cm) 5 7 7.4 6.8 5.4 7 6.6 6.4 y (hardness units) 50 70 85 70 75 60 65 60 a Draw a scatter diagram to represent these data. b
For each of the following data sets plot a scatter diagram, and then describe the correlation. a x 1 2.4 3.6 2.2 4.3 3.3 4.0 0.6 y 6.0 9.0 15.8 7.1 18.6 12.1 15.0 3.7 b x 123 160 285 210 150 240 280 115 180 y 75 70 50 65 70 55 50 80 70.AppendixLO1
The table shows the armspan, in cm, and the height, in cm, of 10 adult men. Height x (cm) 155 160 173 192 181 178 199 166 158 173 Armspan y (cm) 147 159 165 180 a Draw a scatter diagram to represent these data. 170 173 186 162 153 168 b Describe and interpret the correlation between the two
Eight students were asked to estimate the mass of a bag of sweets in grams. First they were asked to estimate the mass without touching the bag and then they were told to pick the bag up and estimate the mass again. The results are shown in the table below. A B C DEF G H Student Estimate of mass
Given x = 18.5 Ex = 36 n = 10 find the value of S AppendixLO1
Given y = 25.7 y2 140 n=5 find the value of S...AppendixLO1
Given x = 15 = 35 = 91 Exy 91 = n 5 find the value of Sy AppendixLO1
Given that S,, = 92, Syy 112 and Sy 100 find the value of the product moment correlation coefficient.AppendixLO1
Given the following summary data, = 367 = 270 Ex 33845 y 12976 Exy = 17135 calculate the product moment correlation coefficient (r) using the formula: Spy 11=6 AppendixLO1
The ages, a years, and heights, hcm, of seven members of a team were recorded. The data were summarised as follows: = a 115 Ea 1899 S571.4 72.1 a Find S b Find the value of the product moment correlation coefficient between a and h. c Describe and interpret the correlation between the age and
In research on the quality of bacon produced by different breeds of pig, data were obtained about the leanness () and taste (f) of the bacon. The data is shown in the table. Leanness 1 1.5 2.6 3.4 5.0 6.1 8.2 Taste t 5.5 5.0 7.7 9.0 10.0 10.2 a Find S. Sa and S. b Calculate the product moment
Eight children had their IQ measured and then took a general knowledge test. Their IQ, (x), and their marks, (y), for the test were summarised as follows: - 973 120 123. - 490 - 33.000 - 61595. a Calculate the product moment correlation coefficient. b Describe and interpret the correlation
In a training scheme for young people, the average time taken for each age group to reach a certain level of proficiency was measured. The data are shown in the table. Age x (years) 16 17 18 19 20 21 22 23 24 25 Average time y (hours) 12 11 10 9 11 8 9 7 6 8 a Find S... S., and Sy b Use your
The following product moment correlation coefficients were calculated i-0.96 ii-0.35 Write down the coefficient that a shows the least correlation, iii 0 iv 0.72 b shows the most correlation.AppendixLO1
Here are some product moment correlation coefficients. i-1, ii-0.5, iv 0.5, v AppendixLO1
Write down which one shows a perfect negative correlation, b zero correlation.AppendixLO1
Ahmed works out the product moment correlation coefficient between the heights of a group of fathers and the heights of their sons to be 0.954. Write down what this tells you about the relationship between their heights.AppendixLO1
Maria draws some scatter diagrams. They are shown below. Write down which scatter diagram shows: i a correlation of +1, ii a correlation that could be described as strong positive correlation, iii a correlation of about -0.97, iv a correlation that shows almost no correlation.AppendixLO1
Jake finds that the product moment correlation coefficients between two variables x and y is 0.95. The product moment correlation coefficient between two other variables s and I was -0.95. Discuss how these two coefficients differ.AppendixLO1
Patsy collects some data to find out if there is any relationship between the numbers of car accidents and computer ownership. She calculates the product moment correlation coefficient between the two variables. There is a strong positive correlation. She says as car accidents increase so does
Raj collects some data to find out whether there is any relationship between the height of students in his year group and the pass rate in driving tests. He finds that there is a strong positive correlation. He says that as height increases, so does your chance of passing your driving test. Is this
Coding is to be used to work out the value of the product moment correlation coefficient for the following sets of data. Suggest a suitable coding for each. a x 2000 2010. 2015 2005 2003 2006 y 3 6 21 6 9 18 b s 100 300 200 400 300 700 t 2 0 1 3 3 6 AppendixLO1
For the two variables x and y the coding of A =x-7 and B-y-100 is to be used. The product moment correlation coefficient for A and B is found to be 0.973. What is the product moment correlation coefficient for x and y?AppendixLO1
Use the coding: p = x and q = y- 100 to work out the product moment correlation coefficient for the following data. x 0 5 3 2 1 100 117 112 110 106 AppendixLO1
The product moment correlation is to be worked out for the following data set using coding. x 50 40 55 45 60 4 y 3 5 4 6 a Using the coding p = and t = y find the values of Spp, S., and Spr- b Calculate the product moment correlation between p and t. c Write down the product moment correlation
The tail length (t cm) and the mass (m grams) for each of eight woodmice were measured. The data is shown in the table. t (cm) 8.5 7.5 8.6 7.3 8.1 7.5 8.0 7.8 m (g) 28 22 26 21 25 20 20 22 a Using the coding x t-7.3 and y = m-20 complete the following table x 1.2 y 8 0 1 0.5 b Find S, Syy and Sy c
A shopkeeper thinks that the more newspapers he sells in a week the more sweets he sells. He records the amount of money (m pounds) that he takes in newspaper sales and also the amount of money he takes in sweet sales (s pounds) each week for seven weeks. The data are shown are the following table.
The following table shows the distance (x) in miles and the cost (y) in pounds of each of 10 taxi journeys. x (miles) 8 6.5 4 2.5 y (pounds) 10.2 8.8 5.5 9 2 10 4.5 7.5 7.2 5.7 7.4 11.0 5.2 12.0 6.4 10.0 a Draw a scatter diagram to represent these data. b Describe and interpret the correlation
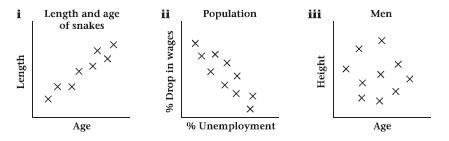
The following scatter diagrams were drawn.a State whether each shows positive, negative or no correlation. b Interpret each scatter diagram in context.AppendixLO1 Length i Length and age ii Population iii Men of snakes X X Age % Drop in wages XX + + % Unemployment Height Age x
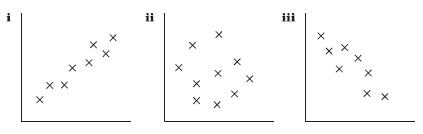
The following scatter diagrams were drawn by a student.The student calculated the product moment correlation coefficient for each set of data. The values were: a -0.12 b 0.87 c -0.81 Write down which value corresponds to each scatter diagram. Give a reason for your answer.AppendixLO1 x x X ii iii X
The product moment correlation coefficient for a person's age and his score on a memory test is -0.86. Interpret this value.AppendixLO1
Wai wants to know whether the 10 people in her group are as good at Science as they are at Art. She collected the end of term test marks for Science (s), and Art (a), and coded them using x and y = 10 The data she collected can be summarised as follows, Ex = 67 = 465 = 65 = 429 = 434. a Work out
Nimer thinks that oranges that are very juicy cost more than those that are not very juicy. He buys 20 oranges from different places, and measures the amount of juice (j ml), that each orange produces. He also notes the price (p) of each orange. The data can be summarised as follows, -979 p-735 a
The following table shows the values of two variables v and m. v 50 70 60 82 45 35 110 70 35 30 m 140 200 180 210 120 100 200 180 120 60 The results were coded using x-v-30 and y- m 20 a Complete the table for x and y. * 20 40 y 7 10 15 40 0 10.5 6 3 b Calculate S, S, and S. (You may use x-287,
Each of 10 cows was given an additive (x) every day for four weeks to see if it would improve their milk yield (y). At the beginning the average milk yield per day was 4 gallons. The milk yield of each cow was measured on the last day of the four weeks. The data collected is shown in the table. Cow
The following table shows the engine size (c), in cubic centimetres, and the fuel consumption (f), in miles per gallon to the nearest mile, for 10 car models. c (cm) 1000 1200 1400 1500 1600 1800 2000 2200 2500 3000 f(mpg) 46 42 43 39 41 37 35 29 28 25 a On graph paper draw a scatter diagram to
In a study on health, a clinic measured the age, (a years), and the diastolic blood pressure, (din mm of mercury), of eight patients. The table shows the results. a (years) 20 35 50 25 60 45 25 70 d (mm) 55 60 80 85 75 85 70 85 a Using the coding x- and y-- 11 calculate S S., and S., b Using your
An NHS trust has the following data on operations. Number of operating theatres 5 6 7 8 Number of operations carried out per day 25 30 35 40 Which is the independent and which is the dependent variable?AppendixLO1
Showing 1900 - 2000
of 2250
First
9
10
11
12
13
14
15
16
17
18
19
20
21
22
23
Step by Step Answers