New Semester
Started
Get
50% OFF
Study Help!
--h --m --s
Claim Now
Question Answers
Textbooks
Find textbooks, questions and answers
Oops, something went wrong!
Change your search query and then try again
S
Books
FREE
Study Help
Expert Questions
Accounting
General Management
Mathematics
Finance
Organizational Behaviour
Law
Physics
Operating System
Management Leadership
Sociology
Programming
Marketing
Database
Computer Network
Economics
Textbooks Solutions
Accounting
Managerial Accounting
Management Leadership
Cost Accounting
Statistics
Business Law
Corporate Finance
Finance
Economics
Auditing
Tutors
Online Tutors
Find a Tutor
Hire a Tutor
Become a Tutor
AI Tutor
AI Study Planner
NEW
Sell Books
Search
Search
Sign In
Register
study help
business
descriptive statistics
Edexcel As And A Level Modular Mathematics Statistics 1 1st Edition Keith Pledger Et Al - Solutions
A park ranger collects data on the number of species of bats in a particular area. Number of suitable habitats 10 24 28 Number of species 1 2 3 Which is the independent and which is the dependent variable?AppendixLO1
The equation of a regression line in the form y = a + bx is to be found. Given that S = 15, Sy 90, 3 and 15 work out the values of a andb. =AppendixLO1
Given S = 30, S., 165, 4 and y = 8 find the equation of the regression line of y on x.AppendixLO1
The equation of a regression line is to be found. The following summary data is given. S = 40, Sy = 80, x=6, y=12. Find the equation of the regression line in the form y = a + bx.AppendixLO1
Data is collected and summarised as follows. = 10 Ex-30 Sy=48 Day 140 4. a Work out,, S, and Sy b Find the equation of the regression line of y on x in the form ya+ bx.AppendixLO1
For the data in the table: 2 4 8 10 y 3 7 8 13 17 a calculate S, and S b find the equation of the regression line of y on x in the form y = a + bxc.AppendixLO1
A field was divided into 12 plots of equal area. Each plot was fertilised with a different amount of fertilizer (h). The yield of grain (g) was measured for each plot. Find the equation of the regression line of g on h in the form ga+bh given the following summary data. h-22.09 g-49.7 -45.04
An accountant monitors the number of items produced per month by a company (n) together with the total production costs (p). The table shows these data. Number of items, 1, (1000s) 21 39 48 24 72 75 15 35 Production costs, p. (1000s) 40 58 67 45 89 96 37 53 (You may use n = 540 = 30786 = 780 . -
The relationship between the number of coats of paint applied to a boat and the resulting weather resistance was tested in a laboratory. The data collected are shown in the table. 1 2 3 4 5 Coats of paint (*) Protection (years) (y) 1.4 2.9 4.1 5.8 7.2 a Calculate S., and S b Find the equation of
Given that the coding p = x + 2 and q =y-3 has been used to get the regression equation p+q= 5 find the equation of the regression line of y on x in the form y = a + bxc.AppendixLO1
Given the coding x = p- 10 and y = s - 100 and the regression equation x = y + 2 work out the equation of the regression line of s on p.AppendixLO1
Given that the coding gand h=-2 has been used to get the regression equation h=6-4g find the equation of the regression line of y on x.AppendixLO1
The regression line of t on s is found by using the coding xs-5 and y =t-10. The regression equation of y on x is y = 14+3x. Work out the regression line of t on s. =AppendixLO1
A regression line of c on d is worked out using the coding x and y = d a Given Sy - 120, S. 240, the mean of x (x) is 5 and the mean of y ) is 6, calculate the regression line of y on x. b Find the regression line of d on c.AppendixLO1
Some data on heights (h) and weights (w) were collected. The results were coded such that x = h-8. 2 and y = . The coded results are shown in the table. x 1 5 10 16 17 y 9 12 16 21 23 a Calculate S., and S, and use them to find the equation of the regression line of y on x. b Find the equation of
Given the regression line y = 24-3x find the value of y when x is 6.AppendixLO1
The regression line for the weight (w) in grams on the volume (v) in cm for a sample of small marbles is w-300+ 12x Calculate the weight when the volume is 7 cm AppendixLO1
a State what is meant by extrapolation. b State what is meant by interpolation.AppendixLO1
12 children between the ages (x) of five and 11 years were asked how much pocket money (y) they were given each week. The equation for the regression line of y on x was found to be y=2x-8. a Use the equation to estimate the amount of money a seven year old would get. State, with a reason, whether
The pulse rates (y) of 10 people were measured after doing different amounts of exercise (x) for between two and 10 minutes. The regression equation y = 0.75x+72 refers to these data. The equation seems to suggest that someone doing 30 minutes of exercise would have a pulse rate of 94.5. State
Over a period of time the sales, (y) in thousands, of 10 similar text books and the amount, (x) in thousands, spent on advertising each book were recorded. The greatest amount spent on advertising was 4.4 thousand, and the least amount was 0.75 thousand. An equation of the regression line for y on
Research was done to see if there is a relationship between finger dexterity and the ability to do work on a production line. The data is shown in the table. Dexterity Score (x) 2.5 Productivity (y) 3 3.5 4 5 5 5.5 6.5 7 8 80 130 100 220 190 210 270 290 350 400 The equation of the regression line
A metal rod was found to increase in length as it was heated. The temperature (t) and the increase in length (mm) were measured at intervals between 30C and 400C degrees. The regression line of I on t was found to be 1 = 0.0091-0.25. a Find the increase in length for a temperature of 300C. b Find
Two variables s and t are thought to be connected by a law of the form t=a+bs, where a and b are constants. a Use the summary data: = 553 7=45.75 549 S = 6193 Est 31185 n 12 5 46.0833 to work out the regression line of t on s. b Find the value of t when s is 50 AppendixLO1
A biologist recorded the breadth (x cm) and the length (y cm) of 12 beech leaves. The data collected can be summarised as follows. 2x = 97.73 Ex = 33.1 a Calculate S, and Sy Sy=66.8 = 195.94 b Find the equation of the regression line of y on x in the form y = a + bx. c Predict the length of a beech
Energy consumption is claimed to be a good predictor of Gross National Product. An economist recorded the energy consumption (x) and the Gross National Product (y) for eight countries. The data are shown in the table. Energy Consumption 3.4 7.7 12.0 75 58 67 113 131 Gross National Product y 55 240
In an environmental survey on the survival of mammals the tail length t (cm) and body length m (cm) of a random sample of six small mammals of the same species were measured. These data are coded such that x and y = -2. = The data from the coded records are summarised below. - 13.5 = 25.5 - 84.25 =
A health clinic counted the number of breaths per minute (r) and the number of pulse beats (p) per minute for 10 people doing various activities. The data are shown in the table. The data are coded such that x=10 and y = P-50 2 * 35 5 7 8 9 9 10 12 13 y 4 9 10 11 17 15 17 19 22 27 (You may use Tx -
A farm food supplier monitors the number of hens kept (x) against the weekly consumption of hen food (y kg) for a sample of 10 small holders. He records the data and works out the regression line for y on x to be y = 0.16 +0.79%. a Write down a practical interpretation of the figure 0.79. b
Water voles are becoming very rare; they are often confused with water rats. A naturalist society decided to record details of the water voles in their area. The members measured the weight (y) to the nearest 10 grams, and the body length (x) to the nearest millimetre, of eight active healthy water
A mail order company pays for postage of its goods partly by destination and partly by total weight sent out on a particular day. The number of items sent out and the total weights were recorded over a seven day period. The data are shown in the table. Number of items (n) 10 13 22 15 24 16. 19
Write down whether or not each of the following is a discrete random variable. Give a reason for your answer. a The average lifetime of a battery. b The number of days in a week. c The number of moves it takes to complete a game of chess.AppendixLO1
A fair die is thrown four times and the number of times it falls with a 6 on the top, Y, is noted. Write down all the possible values of y.AppendixLO1
A bag contains two discs with the number 2 on them and two discs with the number 3 on them. A disc is drawn at random from the bag and the number noted. The disc is returned to the bag. A second disc is then drawn from the bag and the number noted. a Write down the sample space. The discrete random
A discrete random variable X has the following probability distribution: 1 2 3 4 + k P(X-x) Find the value of k.AppendixLO1
The random variable X has a probability function P(X = x)=kx Show that k x=1, 2, 3, 4.AppendixLO1
The random variable X has the probability function P(X = x) = *--1 x = 1, 2, 3, 4,AppendixLO1
Construct a table giving the probability distribution of X.AppendixLO1
The random variable X has a probability function kx P(X-2) Alx-1) where k is a constant. a Find the value of k. * 1,3 *-2,4 b Construct a table giving the probability distribution of X.AppendixLO1
The discrete random variable X has a probability function. 0.1 x -2,-1 *-0,1 0.2 *-2 P(X-x)-8 a Find the value of . b Construct a table giving the probability distribution of X.AppendixLO1
A discrete random variable has the probability distribution shown in the table below. 01 I P(X x)-a 2 a +4 Find the value of a.AppendixLO1
A discrete random variable X has probability distribution * 0 1 2 3 4 5 P(X = x) 0.1 0.1 0.3 0.3 0.1 0.1 a Find the probability that X 3. c Find the probability that 1 < x < 4.AppendixLO1
A discrete random variable X has probability distribution x 0 1 2 3 1 1 P(X = x) x 2 Find a P(1 < x < 3), b P(X < 2). 3 A discrete random variable X has a probability distribution 1 2 3 4 5 6 * P(X = x) 0.1 0.1 0.15 0.25 0.3 0.1 a Draw up a table to show the cumulative distribution function F(x). b
A discrete random variable has a cumulative distribution function F(x) given in the table. * F(x) 012345 6 0 0.1 0.2 0.45 0.5 0.9 1 a Draw up a table to show the probability distribution X. b Write down P(X
The random variable X has a probability function P(X-1){ 1xx x 1, 3, 5 k(x-1) x 2, 4, 6 where k is a constant. a Find the value of k. b Draw a table giving the probability distribution of X. Find P(2X
The discrete random variable X has the probability function x=-2,-1 0.1 P(X-x) 0.3 * 0,1 x-2 a Find the value of a b Draw a table giving the probability distribution of X. c Write down the value of F(0.3).AppendixLO1
The discrete random variable X has a cumulative distribution function F(x) defined by 0 x=0 F(x) 1+x x-1, 2, 3, 4, 5 6 1 x>5 a Find P(X4). b Show that P(X-4) is c Find the probability distribution for X.AppendixLO1
The discrete random variable X has a cumulative distribution function F(x) defined by 0 x=0 (x + k) Fix)- x-1, 2 and 3 16 1 x>5 a Find the value of k. b Find the probability distribution for X.AppendixLO1
Find E(X) and E(X2) for the following distributions of x. a $ 2 4 6 8 P(X = x) 0.3 0.3 0.2 0.2 b 1 2 3 4 P(X = x) 0.1. 0.4 0.1 0.4 AppendixLO1
A biased die has the probability distribution * 1 2 3 4 S 6 P(X = x) 0.1 0.1 0.1 0.2 0.4 0.1 Find E(X) and E(X).AppendixLO1
The random variable X has a probability function P(X = x)=-2,3,6 0 all other values a Construct a table giving the probability distribution of X. b Work out E(X) and E(X2). c State with a reason whether or not (E(X))= E(X).AppendixLO1
Two coins are tossed 50 times. The number of heads is noted each time. a Construct a probability distribution table for the number of heads when the two coins are tossed once, assuming that the two coins are unbiased. b Work out how many times you would expect to get 0, 1 or 2 heads. The following
The random variable X has the following probability distribution. x 1 2 3 4 5 P(X-x) 0.1 a b 0.2 0.1 Given E(X) = 2.9 find the value of a and the value of b.AppendixLO1
A fair spinner with equal sections numbered 1 to 5 is thrown 500 times. Work out how many times it can be expected to land on 3.AppendixLO1
For the following probability distribution x -1 0 1 2 3 P(X = x) 43 IS 13 55 13 a write down E(X), b find Var(X).AppendixLO1
Find the expectation and variance of each of the following distributions of X. a x P(X = x) 1 2 3 x P(X = x) -1 IN - 0 1 e -14 x P(X = x) -2 -1 216 1 16 AppendixLO1
Given that Y is the score when a single unbiased die is rolled, find E(Y) and Var(Y).AppendixLO1
Two fair cubical dice are rolled and S is the sum of their scores. a Find the distribution of S. b Find E(S). c Find Var(S).AppendixLO1
Two fair tetrahedral (four-sided) dice are rolled and D is the difference between their scores. a Find the distribution of D and show that P(D = 3) = b Find E(D). c Find Var(D).AppendixLO1
A fair coin is tossed repeatedly until a head appears or three tosses have been made. The random variable T represents the number of tosses of the coin. a Show that the distribution of T is t 1 2 3 P(T-t) 1 b Find the expectation and variance of T.AppendixLO1
The random variable X has the following distribution: x 1 2 3 P(X = x) a b a where a and b are constants. a Write down E(X). b Given that Var(X) = 0.75, find the values of a and b.AppendixLO1
E(X) = 4, Var(X) = 10 Find a E(2X), AppendixLO1
E(X) = 2, Var(X) = 6 Find a E(3X), e Var (3X), b Var (2X). b E(3X + 1), C E(X-1), d E(4-2X), f Var (3x+1), g Var (X-1).AppendixLO1
The random variable X has a mean of 3 and a variance of 9. Find a E(2X + 1), b E(2 + X), Var(2X + 1), d Var(2 + X).AppendixLO1
The random variable X has a mean and standard deviation . Find, in terms of and o u a E(4X), b E(2X + 2), C E(2X-2), d Var(2X + 2), e Var(2X-2).AppendixLO1
The random variable Y has mean 2 and variance AppendixLO1
Find: a E(3Y+1), b E(2-3Y), c Var(3Y + 1), d Var(2-3), e E(Y), f E[(Y 1)(Y+1)].AppendixLO1
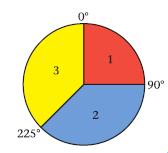
A fair spinner is made from the disc in the diagram and the random variable X represents the number it lands on after being spun. a Write down the distribution of X. c Find Var(X). e Find Var(3X-1). b Work out E(X). d Find E(2X + 1).AppendixLO1 0 3 1 90 225 2
The discrete variable X has the probability distribution 0 12 x -1 P(X = x) 0.2 0.5 0.2 0.1 a Find E(X), b Find Var (X), c Find E(X + 1), d Find Var(x + 1).AppendixLO1
X is a discrete uniform distribution over the numbers 1, 2, 3, 4 and 5, Work out the expectation and variance of X.AppendixLO1
Seven similar balls are placed in a bag. The balls have the numbers 1 to 7 on them. A ball is drawn out of the bag. The variable X represents the number on the ball. a Find E(X). b Work out Var(X).AppendixLO1
A fair die is thrown once and the random variable X represents the value on the upper face. a Find the expectation and variance of X. b Calculate the probability that X is within one standard deviation of the mean.AppendixLO1
A card is selected at random from a pack of cards containing the even numbers 2, 4, 6, ..., 20. The variable X represents the number on the card. a Find P(X > 15). b Find the expectation and variance of X.AppendixLO1
Repeat Question 4 for the odd numbers 1, 3, 5, ..., 19, AppendixLO1
A straight line is drawn on a piece of paper. The line is divided into four equal lengths and the segments are marked 1, 2, 3 and 4. In a party game a person is blindfolded and asked to mark a point on the line and the number of the segment is recorded. A discrete uniform distribution over the set
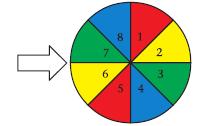
In a fairground game the spinner shown is used. It cost 5p to have a go on the spinner. The spinner is spun and the number of pence shown is returned to the contestant.If X is the number which comes up on the next spin, a name a suitable model for X, b find E(X), c find Var(X), d explain why you
State whether each of the following variables is qualitative or quantitative. a Height of a tree. b Colour of car. c Time waiting in a queue. d Shoe size. e Name of pupils in a class.AppendixLO1
State whether each of the following quantitative variables is continuous or discrete. a Shoe size. b Length of leaf. c Number of people on a bus. d Weight of sugar. e Time required to run 100 m. f Lifetime in hours of torch batteries.AppendixLO1
Explain why a 'Type of tree' is a qualitative variable. b 'The number of pupils in a class' is a discrete quantitative variable. c "The weight of a collie dog' is a continuous quantitative variable.AppendixLO1
The nurse at a health centre records the heights, h cm, to the nearest cm, of a group of boys in the same school age group. The frequency table shows the results. Cumulative h Frequency (f) frequency 165 8 a Complete the table by putting in the cumulative frequency totals. 166 7 167 9 b State the
The distribution of the lifetimes of torch batteries is shown in the grouped frequency table below. Lifetime Frequency Cumulative frequency (nearest 0.1 of an hour) 5.0-5.9 5 6.0-6.9 8 7.0-7.9 10 8.0-8.9 22 9.0-9.9 10 10.0-10.9 2 a Complete the cumulative frequency column. b Write down the class
The distribution of the weights of two-month-old piglets is shown in the grouped frequency table below. Weight (kg) Frequency Cumulative frequency 1.2-1.3 8 1.3-1.4 28 1.4-1.5 32 1.5-1.6 22 a Write down the class boundaries for the third group. b Work out the mid-point of the second
Write down which of the following statements are true. a The weight of apples is discrete data. b The number of apples on the trees in an orchard is discrete data. c The amount of time it takes a train to make a journey is continuous data. d David collected data on car colours by standing at the
Meryl collected wild mushrooms every day for a week. When she got home each day she weighed them to the nearest 100 g. The weights are shown below. 500 700 400 300 900 700 700 a Write down the mode for these data. b Calculate the mean for these data. c Find the median for these data. On the next
Joe collects six pieces of data x1, x2, x3, x4, x5 and x. He works out that x is 256.2. a Calculate the mean for these data. He collects another piece of data. It is 52. b Write down the effect this piece of data will have on the mean.AppendixLO1
A small workshop records how long it takes, in minutes, for each of their workers to make a certain item. The times are shown in the table. Worker A B C D E F G HI Time in minutes 7 12 10 8 6 8 5 26 11 9 a Write down the mode for these data. b Calculate the mean for these data. c Find the median
A farmer keeps a record of the weekly milk yield of his herd of seven cows over a period of six months. He finds that the mean yield is 24 litres. He buys another cow that he is told will produce 28 litres of milk a week. Work out the effect this will have on the mean milk yield of his
A clothes retailer has two shops in the town of Field-gate. Shop A employs 15 people and shop B employs 22 people. The mean number of days of sickness in a year taken by the employees in shop A is 4.6 and the mean number of days of sickness taken by the employees in shop B is 6.5 days. Calculate
The rainfall in a certain seaside holiday resort was measured, in millimetres, every week for ten weeks. The hours of sunshine were also recorded. The data are shown in the table. Rainfall (mm) 0 1 2 3 3 26 3 2 3 0 Sunshine (hours) 70 15 10 15 18 0 15 21 21 80 a Calculate the mean rainfall per
The mean marks for a statistics exam were worked out for three classes. Class 1 had 12 students with a mean mark of 78%. Class 2 had 16 students with a mean mark of 84%. Class 3 had 18 students with a mean mark of 54%. Work out the mean % mark to the nearest whole number for all 46
The marks scored in a multiple choice statistics test by a class of students are: 5 9 6 10 9 8 5 5 7 9 7 8 6 10 10 7 9 6 9 7 7 7 8 6 9 7 8 6 7 8 7 9 8 5 a Draw a frequency distribution table for these data. b Calculate the mean mark for these data. c Write down the number of students who got a mark
The table shows the number of eggs laid in 25 blackbirds' nests. Number of eggs 01 2 3 4 5 6 7 Number of nests 0 0 0 1 3 9 8 4 Using your knowledge of measures of location decide what number of eggs you could expect a blackbird's nest to contain. Give reasons for your answer.AppendixLO1
The table shows the frequency distribution for Number of Frequency the number of petals in the flowers of a group of celandines. petals (A) a Work out how many celandines were in the group. 5 8 b Write down the modal number of petals. 6 57 c Calculate the mean number of petals. d Calculate the
The frequency table shows the number of breakdowns,b, per month recorded by a road haulage firm over a certain period of time. Breakdowns b Frequency f Cumulative frequency 0 8 8 1 11 19 2 12 31 3 3 34 4 1 35 5 10 1 36 a Write down the number of months for which the firm recorded the breakdowns. b
A company makes school blazers in eight sizes. The first four sizes cost 48. The next three sizes cost 60 and the largest size costs 76.80. Write down, with a reason which of the mean, mode, or median cost the company is likely to use in advertising its average price.AppendixLO1
A hotel is worried about the reliability of its lift. It keeps a weekly record of the number of times it breaks down over a period of 26 weeks. Number of breakdowns 0-1 Frequency of breakdowns (f) The data collected are summarised in the 18 table opposite. 2-3 7 a Estimate the mean number of
The weekly wages (to the nearest ) of the production line workers in a small factory is shown in the table. a Write down the modal class. Weekly Number of wage workers,f, 175-225 4 b Calculate an estimate of the mean wage. 226-300 8 c Use interpolation to find an estimate for the median wage.
The noise levels at 30 locations near an outdoor concert venue were measured to the nearest decibel. The data collected is shown in the grouped frequency table. Noise (decibels) 65-69 70-74 75-79 80-84 85-89 90-94 95-99 Frequency (f) 1 4 6 6 8 4 1 a Calculate an estimate of the mean noise level. b
DIY store A considered that it was good at employing older workers. A rival store B disagreed and said that it was better. The two stores produced a frequency table of their workers' ages. The table is shown below Age of workers Frequency store (to the nearest year) A Frequency store B 16-25 5 4
The speeds of vehicles passing a checkpoint were measured over a period of one hour, to the nearest mph. The data collected is shown in the grouped frequency table.Speed (mph) 21-30 31-40 41-50 51-60 61-65 66-70 71-75 No. of vehicles (f) 4 7 38 42 5 3 1 a Write down the modal class. b Calculate the
Showing 2000 - 2100
of 2250
First
9
10
11
12
13
14
15
16
17
18
19
20
21
22
23
Step by Step Answers