New Semester
Started
Get
50% OFF
Study Help!
--h --m --s
Claim Now
Question Answers
Textbooks
Find textbooks, questions and answers
Oops, something went wrong!
Change your search query and then try again
S
Books
FREE
Study Help
Expert Questions
Accounting
General Management
Mathematics
Finance
Organizational Behaviour
Law
Physics
Operating System
Management Leadership
Sociology
Programming
Marketing
Database
Computer Network
Economics
Textbooks Solutions
Accounting
Managerial Accounting
Management Leadership
Cost Accounting
Statistics
Business Law
Corporate Finance
Finance
Economics
Auditing
Tutors
Online Tutors
Find a Tutor
Hire a Tutor
Become a Tutor
AI Tutor
AI Study Planner
NEW
Sell Books
Search
Search
Sign In
Register
study help
business
essentials business analytics
Introduction To Business Analytics 1st International Edition Vernon Richardson Marcia, Weidemeier Watson - Solutions
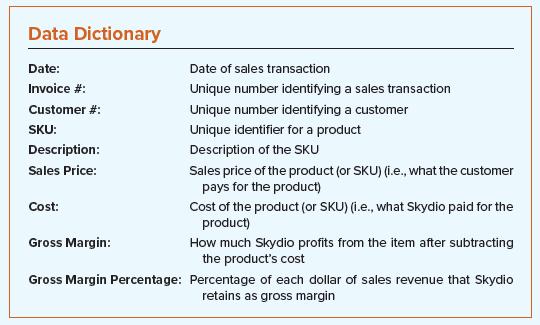
7. (LO 3.3, 3.4) Let’s analyze the sales transactions by SKU. Create a pivot table in Excel showing the average sales price, cost, gross margin, and gross margin percentage for each SKU. For ease of use, format all numbers with two decimals. Use the pivot table to answer the following
6. (LO 3.1, 3.3, 3.4, 3.5) Let’s analyze all of the sales transactions together. In Excel, calculate descriptive statistics for sales price, cost, gross margin, and gross margin percentage for all sales transactions. Use the output to answer the following questions:a. How many rows of data are in
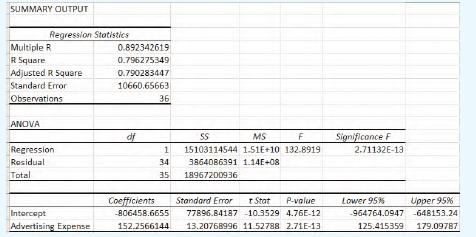
5. (LO 3.8) A company wants to evaluate the relationship between sales revenue and advertising expenditures. A data analyst ran a regression analysis that generated the following output:a. What is the dependent variable? What is the independent variable?b. Is this an example of a simple regression
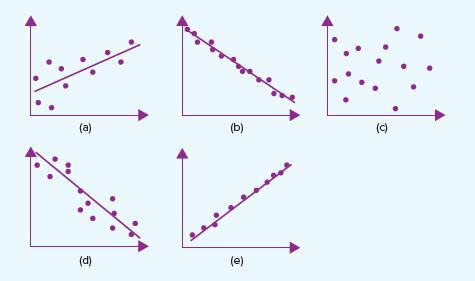
4. (LO 3.8) Examine the scatterplots below. Identify which scatterplot exhibits:a. Strong positive correlationb. Positive correlationc. No correlationd. Negative correlatione. Strong negative correlation (e) (d) (b) (e) (c)
3. (LO 3.8) Identify whether you expect a positive correlation, a negative correlation, or no correlation for the following scenarios.a. The relationship between time spent brushing your teeth and the number of cavitiesb. The relationship between a car’s age and auto repair costsc. The
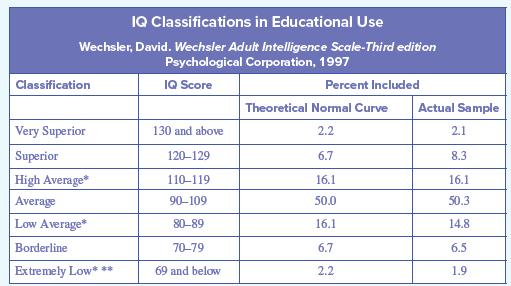
2. (LO 3.3, 3.6) Consider the following table.a. How is this IQ classification consistent with the z-score and confidence interval if the average population IQ is 100 and the standard deviation is 15?b. If your IQ is 130, the average population IQ is 100, and the standard deviation is 15, what is
1. (LO 3.1, 3.6) Answer the following questions about hypothesis testing. Assume that:Ho: The company’s ROA is the same as the industry’s average ROA.HA: The company’s ROA is not the same as the industry’s average ROA.a. If the alpha threshold is 0.05, and the p-value on a t-test comparing
5. (LO 3.2) Match each term with its definition.Sampling Techniques and Biases Definitions 1. simple random samplinga. A sampling method in which every observation in the population has an equal chance of being selected 2. stratified random samplingb. Method of collecting data based from
4. (LO 3.3) Match each term to its definition.Term Definition 1. mediana. The extent to which data are asymmetric about their mean 2. symmetricalb. Describes a data set in which the mean, median, and mode are equal 3. rangec. The average of a distribution 4. standard deviationd. The difference
3. (LO 3.6, 3.7, 3.8) Match each hypothesis test to its description.Hypothesis Test Description 1. ANOVAa. A statistical test used to determine how closely observed, or realized, data fit the expected data 2. chi-square testb. Statistical analysis used to understand the relationship between a
2. (LO 3.1, 3.4, 3.5, 3.6, 3.8) Match each business analytics statistical function in Excel’s Analysis ToolPak to its use.Business Analytics Statistical Function Use 1. correlationa. To determine if there is a significant difference between the means of two groups or two data sets 2. regressionb.
1. (LO 3.1, 3.3, 3.5) Match each statistical term to its definition.Statistical Term Description 1. interquartile rangea. A characteristic of a population 2. histogramb. A characteristic of a sample 3. parameterc. A visual representation of a frequency distribution 4. statisticd. The difference
11. (LO 3.8) If you wanted to predict expected sales revenue from advertising expenditures, would you use simple or multiple regression analysis? What would be the independent variable, and what would be the dependent variable?
10. (LO 3.4) How would you simultaneously generate the mean, median, mode, standard deviation, and skewness for a set of data in Excel?
9. (LO 3.2) Assume that a company wants to collect customer survey data by state. The company knows that all customers will not respond. It also wants to make sure that responses are included from customers in all states. What method of sampling discussed in this chapter would be the best for the
8. (LO 3.1) To prepare its payroll, a company requires all of its employees to submit a weekly, digital time sheet showing hours worked broken down by task. Are the data collected by the time sheets an example of a population or a sample? Would the data analysis calculate and use parameters or
7. (LO 3.5) Managers want a visualization showing the total number of employees aggregated by the following age groups: < 18, 18–30, 31–50, 51–65, > 65. To create this visualization, would you use a bar chart or a histogram? Why?
6. (LO 3.5) What is the difference between a bar chart and a histogram? If you want to create a visualization of the total number of employees for each company department, would you use a bar chart or a histogram? Explain.
5. (LO 3.6, 3.7) What is the difference between an ANOVA test and a t-test?
4. (LO 3.6) If the p-value of the test statistic in a hypothesis test equals 0.04 and alpha is set at 5%, do you reject or fail to reject the null hypothesis?
3. (LO 3.5) When comparing data sets, which visualization is more helpful, a histogram or a box plot? Why?
2. (LO 3.3) Why are standard deviation and the interquartile range better measures of dispersion than range?
1. (LO 3.3) What is a limitation of range as a measure of dispersion?
10. (LO 3.4) What is the name of the tool that you can use for quickly calculating statistics in Excel (other than Excel functions)?a. Summary Cardb. Descriptive Statisticsc. Regressiond. T-test
9. (LO 3.2) Every observation in the population has an equal chance of being selected into the sample in which type of sampling method?a. Cluster samplingb. Stratified samplingc. Simple random samplingd. Convenience sampling
8. (LO 3.6) Which of the following is the base case with the assumption that the hypothesized relationship does not exist, that there is no significant difference between two samples or populations?a. Null hypothesisb. Alternative hypothesisc. Original scenariod. Default assumption
7. (LO 3.8) Which of the following is used to predict a specific dependent variable value based on independent variable inputs?a. Correlationb. Regression analysisc. T-testd. ANOVA test
6. (LO 3.7) Which statistical test is used to determine how closely observed data fit the expected data?a. Chi-squareb. Regressionc. ANOVAd. Correlation
5. (LO 3.7) Which of the following is used to test for a difference of means between three or more groups?a. T-testb. Regression analysisc. ANOVA testd. Correlation
4. (LO 3.3) Which quartile is the cutoff for the median?a. Quartile 1b. Quartile 2c. Quartile 3d. Quartile 4
3. (LO 3.6) If p-value ≤ alpha threshold, you shoulda. reject the null hypothesis; the result is significant.b. fail to reject the null hypothesis; the result is not significant.c. reject the null hypothesis; the result is not significant.d. fail to reject the null hypothesis; the result is
2. (LO 3.5) Which of the following show how data sets compare to each other with a visual representation of data dispersion by quartiles?a. Bar graphsb. Box plotsc. Histogramsd. Line charts
1. (LO 3.1) Which of the following is a characteristic of the population?a. Parameterb. Statisticc. Type I errord. Regression
2. Click the Abc icon next to the new field and adjust the data type to a Whole Number.iii. Begin exploratory analysis:1. Columns: New Customer 2. Rows: Days Past Due – Numericala. Right-click Days Past Due – Numerical and select Measure >Maximum.iv. How does viewing these data in a
1. Create a new calculated field named “Days Past Due – Numerical” with the following calculation: REPLACE([Days Past Due],” days”,’”’)
2. (LO 2.4) This Chapter 2 Problem data set contains a list of outstanding invoices for a fictional company, but the data aren’t ready for analysis yet. Load this data file into Tableau and validate and clean the data by taking the following steps:a. Click the “Use the Data Interpreter”
1. (LO 2.4) The Chapter 2 Problem data set contains a list of outstanding invoices for a fic- DATA VISUALIZATION tional company, but the data aren’t ready for analysis yet. Load this file into Power BI and validate and clean the data. Several of these steps will be repeated from Problems 6 and 7,
7. (LO 2.4) The Receivables Past Due data set contains a list of outstanding invoices for a fictional company, but the data aren’t ready for analysis yet. Using this data file, take the following steps to validate and clean the data for completeness and integrity in Excel:a. The number of records
6. (LO 2.4) The Receivables Past Due data set contains a list of outstanding invoices for a fictional company, but the data aren’t ready for analysis yet. Using this data file, take the following steps to ensure data quality in Excel:a. Assess date types. Are they uniform?b. When date types are
5. (LO 2.1, 2.2) Go to Yahoo! Finance (https://finance.yahoo.com/) and search the symbol for Walmart Inc. (WMT). Click on Historical Data, and find the adjusted daily close price between February 29, 2020, and March 30, 2022.Requireda. Take a screenshot of the first Yahoo! Finance page and label it
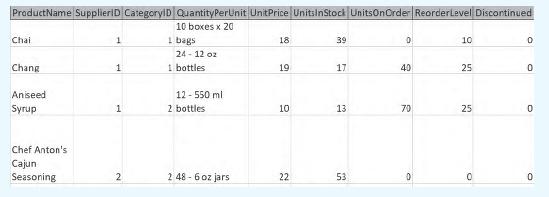
4. (LO 2.3, 2.4) Northwind Traders is a fictitious specialty foods company created by Microsoft, which has also created a fictitious database for the company. The Northwind database includes several tables, including Products, Suppliers, and Categories. Pictured below is a subset of the Products
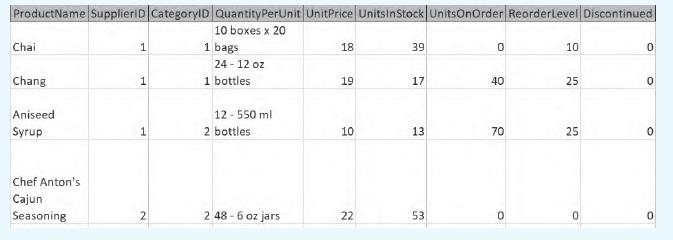
3. (LO 2.3) Northwind Traders is a fictitious specialty foods company created by Microsoft, which has also created a fictitious database for the company. The Northwind database includes several tables, including Products, Suppliers, and Categories. Pictured below is a subset of the Products table,
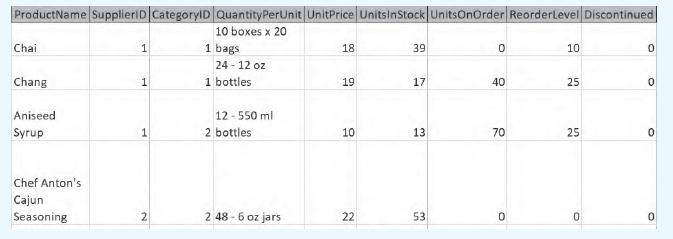
2. (LO 2.3) Northwind Traders is a fictitious specialty foods company created by Microsoft, which has also created a fictitious database for the company. The Northwind database includes several tables, including Products, Suppliers, and Categories. Pictured below is a subset of the Products table,
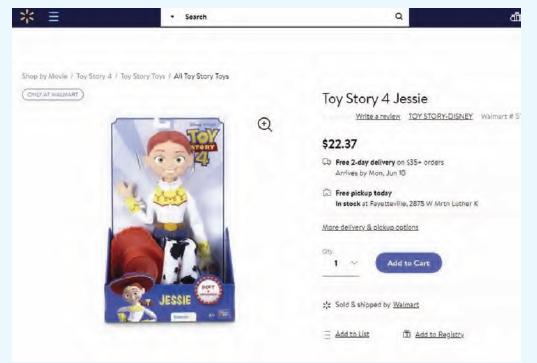
1. (LO 2.3) In the Mini Case on Tide PODS in this chapter, you saw how a customer-facing display of data on Amazon’s website reflects different data types. Based on the data types identified in the Mini Case, it is easy to imagine what a row of data in Amazon’s Products table might look
6. (LO 2.5) Match the software tool (Alteryx, Excel, Gretl, Power BI, Python, Tableau, Tableau Prep) with its description.Description of Software Tool Software Tool Similar to Tableau Prep, but offers more file types for the output and more advanced analytics Usually considered the best software
5. (LO 2.3) What is the data type for each of these variables in a products table? Choose from short text, long text, currency, Y/N flag, or number.Field Name Data Type (Short Text, Long Text, Currency, Y/N Flag, Number)Product name Product description Sales price Coupon available Free shipping
4. (LO 2.3) Identify each summarization method as numerical, categorical, or both.Summarization Method Numerical, Categorical, or Both Counting and grouping Averaging Proportion Ranking Summing
3. (LO 2.1, 2.2, 2.3, 2.4) Match each term to its definition.Term Definition 1. Data dictionarya. Categorical data that cannot be ranked 2. Nominal datab. Numerical data measured along a scale with an equal and definitive distance between each data point, but no meaningful zero 3. Ordinal datac.
2. (LO 2.3) Match each data example to its appropriate data type. Choose from structured nominal, structured ordinal, structured interval, structured ratio, or unstructured.Data Example Data Type (Structured Nominal, Structured Ordinal, Structured Interval, Structured Ratio, or Unstructured)SAT
1. (LO 2.3) Match each data example to its appropriate data type: categorical or numerical.Data Example Data Type (Categorical or Numerical)Fahrenheit scale Survey answers: agree, indifferent, disagree Advertising expense Employee choice of retirement plan vendor (Fidelity, Edward Jones,
10. (LO 2.1) Why is an understanding of the way data are structured in a relational database(particularly regarding primary keys and foreign keys) important?
9. (LO 2.4) Which step in the ETL process (ensuring data quality, validating the data, cleansing the data, or performing preliminary exploratory analysis) do you think is the most time consuming? Which do you think is the most important? Why?
8. (LO 2.3) Are exam grades classified as interval data or ratio data? Why? Keep in mind that in typical exams, a score of 0 means that you answered every question wrong (or didn’t answer the question at all). Does this 0 score indicate an absolute absence of knowledge? If Student A earns 40
7. (LO 2.3) Why is temperature measured using a Fahrenheit scale not considered to be ratio data?
6. (LO 2.3) Why is net income or net sales better defined as ratio data instead of interval data?
5. (LO 2.1) Refer to the previous question concerning the internal data that can be used to predict Walmart’s sale of pecans at Thanksgiving. Which external data would be helpful in predicting these sales?
4. (LO 2.1) If you could have any internal data you wanted, which data would you use to predict Walmart’s sale of pecans at Thanksgiving time each year?
3. (LO 2.1) How could economic indicators, such as unemployment and GDP, help predict sales in the next quarter and the next year?
2. (LO 2.4) Why is validating the data for completeness and integrity an important component of obtaining the data?
1. (LO 2.4) What is ETL and how does it relate to obtaining the data?
10. (LO 2.4) Which function in Excel or Power BI can be used to remove nonprintable characters?a. TRIM()b. CLEAN()c. REMOVE()d. CUT()
9. (LO 2.3) A measure in Tableau is which type(s) of data?a. Categoricalb. Numericalc. Both categorical and numerical
8. (LO 2.3) A dimension in Tableau is which type(s) of data?a. Categoricalb. Numericalc. Both categorical and numerical
7. (LO 2.3) Averaging is a summarization method for which type(s) of data?a. Categoricalb. Numericalc. Both categorical and numerical
6. (LO 2.3) The data in the Transaction_Type column in Exhibit 2.2 are:a. ratio data.b. nominal data.c. numerical data.d. ordinal data.
5. (LO 2.3) If there are five transactions on 12/1, four transactions on 12/2, and nine transactions on 12/3, what proportion of the transactions that occur during the first three days of December took place on 12/1?a. 18 ÷ 5b. 5 ÷ 12c. 5 ÷ 18d. 5 ÷ 9
4. (LO 2.3) If a company has 20 return transactions and 50 sales transactions, what is the proportion of return transactions?a. 20 ÷ 70b. 20 ÷ 50c. 70 ÷ 20d. 50 ÷ 20
3. (LO 2.3) Employee salaries are examples of:a. interval data.b. ratio data.c. ordinal data.d. unstructured data.
2. (LO 2.3) Data that identify letter grades for students (A, B, C, D, F) are:a. ratio data.b. ordinal data.c. numerical data.d. interval data.
1. (LO 2.3) The text in blog posts is generally considered to be:a. structured data.b. interval data.c. unstructured data.d. ratio data.
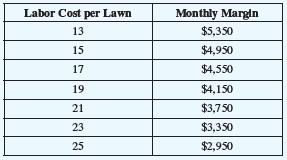
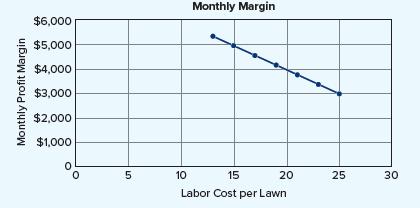
2. (LO 1.6) Is the data visualization shown in Exercise 1 better or worse than the same data in the following tabular format? Explain. Labor Cost per Lawn Monthly Margin 13 $5,350 15 $4,950 17 $4,550 19 $4,150 21 $3,750 23 $3,350 25 $2,950
1. (LO 1.6) What does the following data visualization tell us about the relationship between labor cost per lawn mowed and monthly (profit) margin (the extent to which revenues exceed expenses) as shown on the vertical axis? Monthly Profit Margin $6,000 $5,000 $4,000 $3,000 $2,000 $1,000 Monthly
10. (LO 1.5) Download the file Regional Sales Dataset.xlsx. Using Excel, summarize sales by month, by sales region (regions 1–4), and by both month and region using a pivot table.(This problem may require a review of Excel skills, which you will find in Appendix A at the back of this
9. (LO 1.5) Download the file Monthly Sales Dataset.xlsx. Using Excel, summarize monthly sales and compute the percent change from one month to the next. To calculate percent change, calculate (Current Month Sales – Prior Month Sales)/Prior Month Sales.(This problem may require a review of Excel
8. (LO 1.5) Download the SkyDio Drone SKU data set. In Excel, calculate the gross margin(Sales Price – Cost) and gross margin percentage [(Sales Price – Cost)/Sales Price] for each SKU (product). (This problem may require a review of Excel skills, which you will find in Appendix A at the back
7. (LO 1.5) Download the DJI Mavic Drone SKU data set. In Excel, calculate the gross margin(Sales Price – Cost) and gross margin percentage [(Sales Price – Cost)/Sales Price]for each SKU (product). (This problem may require a review of Excel skills, which you will find in Appendix A at the back
6. (LO 1.5) The recommended level of retirement savings an individual should have saved at each age as follows:a. At age 30: 1X income at age 30b. At age 40: 3X income at age 40c. At age 50: 5X income at age 50d. At age 70: 7X income at age 70 Bob makes $90,000 a year in income at age 50, and his
#!# 5. (LO 1.5) The Harps grocery store chain buys its paper goods (paper towels, toilet paper, tissues) in bulk from one supplier to get a discount. Assume that about once a month it runs out of stock of a few of these items. Harps is concerned that these stockouts are causing customers to shop
3. (LO 1.4) For each of the questions in Problem 2, determine which type of analytics might address it: marketing analytics, accounting analytics, financial analytics, and/or operations analytics. Some questions may have two possible answers. Support your reasons for each answer.4. (LO 1.2) Explain
2. (LO 1.4, 1.5) Tesla is considering each of the following questions. Identify whether the company will use descriptive, diagnostic, predictive, prescriptive, or adaptive/autonomous tools to answer them. Provide support for your answers.a. What are the forecasted Tesla sales in China for the next
1. (LO 1.4, 1.5) How might data analytics be used in the each of the following situations?Explain your answer.a. Determining where to locate a Black Bear Diner (a restaurant that serves homestyle and old-fashioned comfort foods) in Lawrence, Kansasb. Deciding which gaming app to build and market
6. (LO 1.2) Match each definition to the correct term. All terms refer to the information value chain.a. Datab. Contextc. Informationd. Knowledgee. Decision Definition Term Raw numbers and facts that have little meaning on their own Understanding of, or familiarity with, information gained through
5. (LO 1.5) For each business analytics question below, identify the questions it is answering.Choose from this list:a. What happened? What is happening?b. Why did it happen? What are the causes of past results?c. Will it happen in the future? What is the probability something will happen? Can we
4. (LO 1.1, 1.2, 1.4, 1.5) Match each business analytics term to its definition.Term Definition 1. Data integritya. Raw numbers and facts that have little meaning on their own 2. Business analyticsb. Analytics used to evaluate the promotion, distribution, and selling of a product or service.3.
3. (LO 1.5) For each business analytics task, identify the correct step in the SOAR analytics model.Business Analytics Task SOAR Analytics Model Component(Specify the question, Obtain the data, Analyze the data, or Report the results)Deciding which data to use in the analysis Running a statistical
2. (LO 1.5) For each business analytics task, identify the correct step in the SOAR analytics model.Business Analytics Task SOAR Analytics Model Component(Specify the question, Obtain the data, Analyze the data, or Report the results)Creating a dashboard that provides daily sales in the Northeast
1. (LO 1.1, 1.2, 1.4, 1.5) Match each business analytics term to its definition.Term Definition 1. Informationa. The setting, event, statement, or situation in which data can be more fully understood and evaluated 2. Dashboardb. Access or exposure to too much data, which prevents data from being
10. (LO 1.6) Some argue that a picture is worth a thousand clicks. Argue for and against the use of data visualizations when reporting the results.
9. (LO 1.5) Consider the data qualities of relevance and reliability. Explain why each quality and both qualities together are valuable to business analysts.
8. (LO 1.5) Identify the five sets of questions that are asked in business analytics. Brainstorm different types of business-related questions that might fit in each of the five question sets.
7. (LO 1.5) Identify the four steps in the SOAR analytics model. Explain how marketing analysts might use the SOAR model to help Netflix better understand its customers.
6. (LO 1.4) Compare and contrast financial analytics with operations analytics. How are they similar? How are they different?
5. (LO 1.4) Compare and contrast marketing analytics with accounting analytics. How are they similar? How are they different?
4. (LO 1.3) Explain the difference between a decision-maker, a data scientist, and a business analyst. What is the role of each?
3. (LO 1.3) Explain the information value chain by summarizing how data are transformed into knowledge insights for decision-making. Use the example of a book review of this book on Amazon and how it might help the publisher, McGraw Hill, determine whether to revise this book for a new, updated
2. (LO 1.2) Explain the information value chain by summarizing how data are transformed into knowledge insights for decision-making. Use the example of a book review on Amazon and how it might lead Amazon to decide how many of those books to stock at its warehouses.
1. (LO 1.1) Give five examples of business processes at Tesla. How do they create business value for Tesla and its shareholders?
15. (LO 1.6) Which common visualization type shows the composition of values over time?a. Line graphb. Scatterplotc. Pie chartd. Bar chart
14. (LO 1.6) Which common visualization type shows trends in values over time?a. Line graphb. Scatterplotc. Pie chartd. Bar chart
13. (LO 1.5) Suppose a company has timely product reviews that are available when needed, but the reviews are biased. These product reviews are which type of data?a. Reliableb. Relevantc. Curatedd. Consistent
Showing 300 - 400
of 754
1
2
3
4
5
6
7
8
Step by Step Answers