New Semester
Started
Get
50% OFF
Study Help!
--h --m --s
Claim Now
Question Answers
Textbooks
Find textbooks, questions and answers
Oops, something went wrong!
Change your search query and then try again
S
Books
FREE
Study Help
Expert Questions
Accounting
General Management
Mathematics
Finance
Organizational Behaviour
Law
Physics
Operating System
Management Leadership
Sociology
Programming
Marketing
Database
Computer Network
Economics
Textbooks Solutions
Accounting
Managerial Accounting
Management Leadership
Cost Accounting
Statistics
Business Law
Corporate Finance
Finance
Economics
Auditing
Tutors
Online Tutors
Find a Tutor
Hire a Tutor
Become a Tutor
AI Tutor
AI Study Planner
NEW
Sell Books
Search
Search
Sign In
Register
study help
business
essentials business analytics
Introduction To Business Analytics 1st International Edition Vernon Richardson Marcia, Weidemeier Watson - Solutions
3. (LO 9.3) Describe two sources of financial statement data.
2. (LO 9.2) What types of questions are representative of those in the investments finance function?
1. (LO 9.1) Compare and contrast the three primary branches of finance.
11. (LO 9.8) Visualizations that show performance relative to relevant benchmarks are examples ofa. prescriptive analytics.b. descriptive analytics.c. diagnostic analytics.d. predictive analytics.
10. (LO 9.6) To predict whether firms are at high or low risk of bankruptcy, analysts can use the predictive analytics technique ofa. sensitivity analysis.b. regression analysis.c. classification analysis.d. time series analysis.
9. (LO 9.4) Which of the following has a higher risk and higher return than a corporate bond?a. Treasury bondb. Treasury billc. Share of stockd. Deposit at a bank
8. (LO 9.5) The ratio of the average return earned in excess of the risk-free rate to a unit of volatility or total risk is thea. Sharpe ratio.b. return on equity (ROE).c. return on asset (ROA).d. current ratio.
7. (LO 9.3) EDGAR serves as a repository for information abouta. stock prices.b. interest rates.c. the economy.d. financial statements.
6. (LO 9.5) The DuPont ratio analysis decomposes return on equity into how many component parts?a. Fourb. Threec. Twod. Five
5. (LO 9.3) XBRL is a means of disclosing financial information in a computer-readable format. Its submission is required by thea. New York Stock Exchange.b. Securities and Exchange Commission.c. Financial Executives Institute.d. Financial Accounting Standards Board.
4. (LO 9.2) Which branch of finance determines how well the company performed relative to the budget?a. Corporate financeb. Investmentsc. Financial market and institutionsd. Banking
3. (LO 9.5) Determining how well a company performed relative to its budget is an example of which type of financial analytics?a. Prescriptive analyticsb. Descriptive analyticsc. Diagnostic analyticsd. Predictive analytics
2. (LO 9.1) The three primary branches of finance include all of the following excepta. corporate finance.b. investments.c. financial market and institutions.d. banking.
1. (LO 9.7) Determining the sensitivity of a bank’s profits to changing interest rates is an example of which type of financial analytics?a. Prescriptive analyticsb. Descriptive analyticsc. Diagnostic analyticsd. Predictive analytics
1. (LO 8.4) Download the SkyDio Drone Sales Journal data set in Excel. Note the sales price and cost of each sale. In Excel, calculate the gross margin percentage (Sales Price– Cost)/Sales Price for each sale (or row in the sales journal). Use either the descriptive statistics tool featured in
9. (LO 8.5) Download the Costs of Production data set in Excel. Note the Units of Production(labeled Production) in Column B and the Total Costs (labeled Cost) by week.Requireda. Perform a regression analysis with Cost as the dependent (outcome) variable and Production as the independent
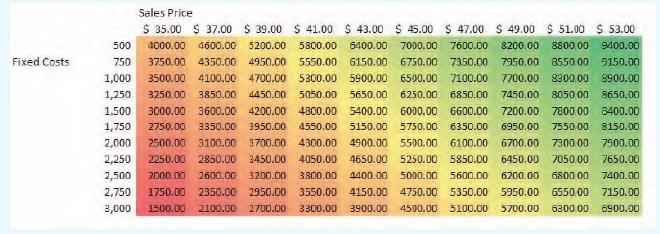
8. (LO 8.7) Using the exhibit and description in Problem 7 above, evaluate the sensitivity of profits to changing levels of fixed costs and product sales price.Requireda. Which has a greater impact on profitability, a $2 increase in sales price or a $250 decrease in total fixed costs?b. How does
7. (LO 8.7) Management accountants can use the following table to perform a sensitivity analysis, evaluating the company’s changing profitability based on two important inputs: (1) the level of total fixed costs and (2) the sales price of the product. Note that the analysis varies the sales price
6. (LO 8.4) SkyDio is attempting to understand its sales and cost structure to understand its overall profitability in relation to each sale. Download the SkyDio Drone Sales Journal data set in Excel. Note the sales price and cost of each sale. In Excel, calculate the gross margin percentage (Sales
5. (LO 8.4) DJI Mavic is attempting to understand its sales and cost structure to allocate appropriate personnel to its sales force. Download the DJI Mavic Drone Sales Journal data set in Excel. Note the sales price and cost of each sale. Either use the descriptive statistics tool featured in
4. (LO 8.4) Refer to Exhibit 8.19. Is J.B. Hunt’s performance improving or declining overall?Why is it improving or declining in the most recent year? Which specific line items help you answer these questions?
3. (LO 8.5) You’re an auditor and you’re looking for fraudulent transactions.Requireda. If you had access to any accounting records you wanted (with details of every transaction), where would you look? Explain.b. How would you find kickbacks to employees from vendors? Where would you look?(See
2. (LO 8.1, 8.4, 8.5, 8.6, 8.7) Describe specific types of questions asked in tax accounting that might require descriptive, diagnostic, predictive, and prescriptive analytics (one question for each). Also describe the types of specific tools and techniques that could be used to address each of
1. (LO 8.1, 8.4, 8.5, 8.6, 8.7) Describe specific types of questions asked in auditing that might require descriptive, diagnostic, predictive, and prescriptive analytics (one question for each). Also describe the types of specific tools and techniques that could be used to address each of those
7. (LO 8.4) Match the business analytics technique included in Excel’s Data Analysis Tool-Pak to its use.Business Analytics Technique Included in Excel’s Data Analysis ToolPak Use Correlation To understand the frequency of the data using a display of rectangles with areas proportional to the
6. (LO 8.4, 8.5, 8.6, 8.7) Match each type of analysis to its analytics type (descriptive, diagnostic, predictive, or prescriptive).Types of Analysis Analytics Type(Descriptive, Diagnostic, Predictive, or Prescriptive)Ratio analytics Bank reconciliation Scenario analytics Pivot table analytics to
5. (LO 8.1, 8.4, 8.5, 8.6, 8.7) Match the analytics type (descriptive, diagnostic, predictive, or prescriptive) and branch of accounting (financial, managerial, audit, or tax) to the analytics technique used.Analytics Technique Used Analytics Type (Descriptive, Diagnostic, Predictive, or
4. (LO 8.2) Categorize each data analytics question below as one of the following question types. Answers may be used more than once.a. What happened? What is happening?b. Why did it happen? What are the causes of past results?c. Will it happen in the future? What is the probability something will
3. (LO 8.3) Match the accounting data sources to the branch of accounting (financial, managerial, audit, or tax).Accounting Data Source Branch of Accounting (Financial, Managerial, Audit, or Tax)SEC filings (10-K, 10-Q)Point-of-sale information Press releases Budget data Detailed depreciation
2. (LO 8.4, 8.5, 8.6, 8.7) Match the analytics type (descriptive, diagnostic, predictive, or prescriptive) to each example accounting question.Example Accounting Question Analytics Type (Descriptive, Diagnostic, Predictive, or Prescriptive)Should we extend credit to a supplier?Will the company be
1. (LO 8.1) Match the branch of accounting (financial, managerial, audit, or tax) to each example accounting question.®Example Accounting Question Branch of Accounting(Financial, Managerial, Audit, or Tax)Are there errors in the financial statements provided by our clients?What is the overall
11. (LO 8.8) How does conditional formatting help analysts find anomalies?
10. (LO 8.7) Which type of analytics will a company use to answer the question of whether it should rent or own its headquarters office building? Explain.
9. (LO 8.7) Which type of analytics will analysts use to optimize company performance based on expected changes in tax law? Explain.
8. (LO 8.6) What is the difference between the predictive analytics techniques of classification and regression?
7. (LO 8.5) Which type of analytics looks for anomalies and outliers? Explain.
6. (LO 8.4) How does vertical analysis serve as a descriptive analytics technique to describe what is happening?
5. (LO 8.3) Describe sources of financial accounting data helpful in addressing questions associated with descriptive analytics.
4. (LO 8.2) What are some examples of diagnostic analytics for those in financial accounting?Managerial accounting?
3. (LO 8.1) Describe questions that external and internal auditors can use business analytics to answer.
2. (LO 8.1) Managerial accounting does not have any rules and standards. How do managerial accountants know which information to analyze?
1. (LO 8.1) Describe the role of tax accounting.
10. (LO 8.4) Which analytics technique evaluates the percentage change in performance from one period to the next?a. Verticalb. What-ifc. Classificationd. Horizontal
9. (LO 8.6) Which predictive analytics technique is generally used to forecast future sales, earnings, and cash flows?a. Time series analysisb. Classificationc. Regressiond. Goal-seek analysis
8. (LO 8.8) A heat map is an example of which type of visualization?a. Conditional highlightingb. Conditional formattingc. A temperature gauged. Horizontal analysis
7. (LO 8.6) Which type of analytics includes classification, regression, and time series analysis techniques?a. Descriptive analyticsb. Diagnostic analyticsc. Predictive analyticsd. Prescriptive analytics
6. (LO 8.6) What prescriptive analytics technique is used to determine the break-even level of sales?a. Sensitivity analysisb. Scenario analysisc. Cash flow analysisd. Goal-seek analysis
5. (LO 8.5) Assessing a company’s cost structure is an example of which type of analytics?a. Descriptive analyticsb. Diagnostic analyticsc. Predictive analyticsd. Prescriptive analytics
4. (LO 8.6) What type of analytics addresses the question of whether an audit firm should accept or reject an audit client?a. Descriptive analyticsb. Diagnostic analyticsc. Predictive analyticsd. Prescriptive analytics
3. (LO 8.3) Which form is a required annual submission to the Securities and Exchange Commission?a. 10-Qb. 10-Kc. 8-Kd. Press release
2. (LO 8.1, 8.2) Budget data are an example of which kind of accounting data?a. Financial accountingb. Managerial accountingc. Auditingd. Tax accounting
1. (LO 8.4) A graph displaying net income over the past four years results from which type of analytics?a. Descriptive analyticsb. Diagnostic analyticsc. Predictive analyticsd. Prescriptive analytics
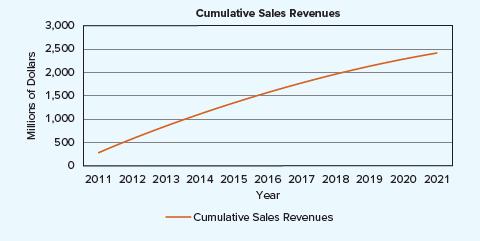
1. When companies sell a product or service, they collect money from customers. Collec- DATA VISUALIZATION tively, this money is called sales revenue. Changes in sales revenue over time are good indicators of how well a company is doing. Companies generally want annual sales revenue to increase
12. (LO 7.4) Use Tableau to create a bar chart that answers this question: How many LEGO sets with a Star Wars theme were released each year from 1949 to 2021? Hint: Four different Star Wars themed set categories should be included. What information does the bar chart reveal about Star Wars themed
11. (LO 7.4) Use Excel to answer the additional questions about num_parts for LEGO sets released from 1949 to 2021.a. What is the average number of parts (num_parts) used for each theme?b. Which theme has the largest average number of parts?c. What is the average number of parts included in the
10. (LO 7.4) An important part of business analytics is understanding the data using descriptive analytics. Use Excel to answer the following questions about num_parts for LEGO sets released from 1949 to 2021. Hint: Make sure the data set includes only these years.a. How many observations are in
9. (LO 7.4) Given the data dictionary above, identify the primary keys in each table and describe how the tables are connected. (If necessary, see Chapter 2 for a review of retrieving data from centralized databases.)
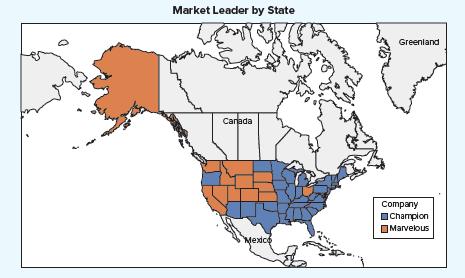
8. (LO 7.8) Marketing data visualizations should help the company understand the impact of its marketing efforts. Examine the marketing data visualization below for two fictitious companies. Champion’s marketing team created a visualization to show how Champion’s market share compares to the
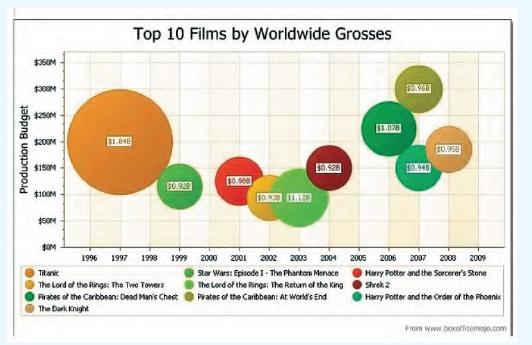
7. (LO 7.8) A well-designed data visualization can be very helpful in understanding a company’s past performance so that managers can adjust current/future activities. The following data visualization was created to answer the following questions:29• How does the production budget required to
6. (LO 7.3) In this chapter, we discuss a customer journey, which is a visual representation of a customer’s interactions with a company. A new process called UX Design is basically a customer journey taken to the nth degree. The term “UX Design” was supposedly coined by Don Norman in the
5. (LO 7.3) Exhibit 7.4 presents an example of a customer journey using LEGO’s experience wheel for a flight from London’s Heathrow airport to New York City. For this problem, (1) select a company, brand, product, or experience and (2) document your own customer journey showing interactive
4. (LO 7.5, 7.6) This chapter describes sources of marketing data, including customers’web search history, social media posts, and purchase history. Analyzing this information can reveal private information, such as financial problems, illness, and pregnancy. The following story appeared in both
3. (LO 7.4, 7.5, 7.6, 7.7) Panera Bread sends out emails to customers to entice them to come and purchase food. Companies can tell if (and when) customers open emails.Assume that Panera Bread wants to use regression to determine if email open rates are related to subsequent food purchases. What are
2. (LO 7.1, 7.4, 7.5, 7.6, 7.7) This chapter focuses on the traditional four Ps of the marketing mix (product, price, place, and promotion) and briefly introduced additional Ps: planning, process, people, and physical evidence. People refers to having the proper employees with appropriate skills
1. (LO 7.1, 7.4, 7.5, 7.6, 7.7) This chapter focuses on the traditional four Ps of the marketing mix (product, price, place, and promotion) and briefly introduced additional Ps: planning, process, people, and physical evidence. Process is the flow of activities that takes place when the company
6. (LO 7.4, 7.5, 7.6, 7.7) Match the Excel menu option (Data Analysis, What-if Analysis) to the analytics technique used.Analytics Technique Used Excel Menu Option (Data Analysis, What-if Analysis)Average of sales for the last five years Goal-seek analysis to determine the desired CPM rate Scenario
5. (LO 7.4, 7.5, 7.6, 7.7) Match the analytics type (descriptive, diagnostic, predictive, or prescriptive) to the analytics technique used.Analytics Technique Used Analytics Type (Descriptive, Diagnostic, Predictive, or Prescriptive)Goal-seek analysis for CPC rate Ishikawa diagram for low market
4. (LO 7.4, 7.5, 7.6, 7.7) Match the analytics type (descriptive, diagnostic, predictive, or prescriptive) to the analytics technique used.Analytics Technique Used Analytics Type (Descriptive, Diagnostic, Predictive, or Prescriptive)Summarization of last year’s sales data Pivot table for drill
3. (LO 7.3) Match the marketing data to the marketing mix component (product, price, place, or promotion) that it would be most helpful for analyzing.Marketing Data Component of the Marketing Mix (Product, Price, Place, or Promotion)Competitor price Order fulfillment time Google Trends for keywords
2. (LO 7.4, 7.5, 7.6, 7.7) Match each marketing question to the analytics type (descriptive, diagnostic, predictive, or prescriptive) that can help answer it.Marketing Question Analytics Type (Descriptive, Diagnostic, Predictive, or Prescriptive)Why did unit sales decrease in the Great Lakes
1. (LO 7.1) Match each marketing question to the relevant marketing mix component(product, price, place, or promotion).Marketing Question Component of the Marketing Mix (Product, Price, Place, or Promotion)What marketing channels should we use?Should we use a cost-plus, competitor-based, or premium
10. (LO 7.3) Exhibit 7.4 presents an experience wheel to document the customer journey.What other visual methods can companies use to document the customer journey?
9. (LO 7.4, 7.5) How does the use of pivot tables differ between descriptive analytics and diagnostic analytics? Provide an example.
8. (LO 7.3, 7.4, 7.5, 7.6, 7.7, 7.8) Have you ever noticed that almost immediately after you search for something on the internet, you get a pop-up ad for a related item? Why do you think marketers use pop-up ads?
7. (LO 7.3, 7.4, 7.5, 7.6, 7.7, 7.8) IoT, which stands for Internet of Things, refers to a network of physical objects that have a unique ID, connect to the internet, and can gather and share information. Examples include Fitbit, Smart Lock, Ring, and Roomba. These devices offer great features,
6. (LO 7.4, 7.5) What is the difference between a website bounce rate and cart abandonment rate? How are the terms related to conversion rate?
5. (LO 7.3, 7.4, 7.5, 7.6) Assume that a company purchases a month’s worth of ad time on a digital billboard in a major city. How could the company evaluate the campaign’s impact on customers?
4. (LO 7.3) The European Union (EU) General Data Protection Regulation requires internet users to explicitly “opt in” to share their personal information with other parties, such as advertisers. In the United States, “opt out” is more likely to be used, meaning that personal information is
3. (LO 7.4, 7.5) How does KPI usage differ between descriptive analytics and diagnostic analytics? Provide an example.
#!# 2. (LO 7.3) A customer relationship management (CRM) system can be set up to include information about a (potential) customer from the person’s public social media activity, including likes/dislikes and posts about the company and its competitors. Do you believe it is ethical for a company to
1. (LO 7.1, 7.2) Describe the role of marketing and marketing analytics in a company.
15. (LO7.7) A company calculated the net present value (NPV) of an advertising campaign as − $56,700. What decision might this NPV lead to?a. The advertising campaign should be implemented.b. The advertising campaign should not be implemented.c. The advertising campaign will increase sales.d. The
14. (LO 7.5) A company calculated the correlation between sending paper catalogs to customers and sales revenue. The correlation coefficient was 0.92. What does this value indicate?a. Sending paper catalogs and sales revenue are weakly related.b. Sending paper catalogs is negatively related to
13. (LO 7.6) To estimate units sold, a company analyzed its Facebook advertising expenditures and the number of units sold. The result of the analysis was the following equation:Units Sold = 12 + 0.21 FacebookAdExpenditures The company would also like to simultaneously analyze its YouTube
12. (LO 7.6) To estimate units sold, a company analyzed its Facebook advertising expenditures and the number of units sold. The result of the analysis was the following equation:Units Sold = 12 + 0.21 FacebookAdExpenditures Which of the following statements is NOT true based on the equation?a. The
11. (LO 7.6) To estimate units sold, a company analyzed its Facebook advertising expenditures and the number of units sold. The result of the analysis was the following equation:Units Sold = 12 + 0.21 FacebookAdExpenditures This is an example of which type of marketing analytics?a. Descriptiveb.
10. (LO 7.7) Which type of analytics determines what input is needed to achieve a desired goal?a. Descriptiveb. Diagnosticc. Predictived. Prescriptive
9. (LO 7.6) Which type of technique divides leads into those who are likely to purchase and those who are not?a. Classificationb. Decision treec. Regressiond. Sensitivity analysis
8. (LO 7.5) Which technique is used to conduct a root cause analysis?a. Decision treeb. Ishikawa diagramc. Scenario analysisd. Summarization
7. (LO 7.4, 7.5) A graph displaying KPIs for several years by marketing channel is an example of which type of analytics?a. Descriptiveb. Diagnosticc. Predictived. Prescriptive
6. (LO 7.3) Which of the following captures all interactions with a customer?a. Customer journey analyticsb. Digital analyticsc. Social media analyticsd. Web analytics
5. (LO 7.3) A CRM system manages all of a company’s interactions with which of the following?a. Chief executive officersb. Clerical staffc. The corporate suite (C-suite)d. Customers
4. (LO 7.2) Which type of analytics addresses the question of how a promotion will affect each marketing channel?a. Descriptiveb. Diagnosticc. Predictived. Prescriptive
3. (LO 7.2) Which term refers to the final product distribution points?a. Conversion pointsb. Leadsc. Marketing channelsd. Marketing mix
2. (LO 7.8) What combines multiple data visualizations and other analyses to track multiple key performance indicators?a. Marketing dashboardb. Ishikawa diagramc. Marketing mixd. Scenario analysis
1. (LO 7.1) Which phrase refers to the key choices that a company makes to bring a product/service to market?a. Marketing channelsb. Marketing mixc. Product life cycled. Root cause
10. (LO 6.2, 6.3) The data set HackUsNow.xlsx includes an additional column labeled Computer Age that has not been analyzed yet. Ask a question related to Computer Age and hacks. Then create a data visualization in Tableau to answer that question. What conclusion, if any, did you make based on the
9. (LO 6.2) Using the HackUsNow.xlsx data, create a data visualization in Tableau to answer the question “Which location has the most hacks?”
8. (LO 6.2) Using the data in HackUsNow.xlsx, create a data visualization in Tableau to clearly answer the question “Which employees experienced more than the average number of hacks?”
7. (LO 6.2) Problem 5 presents a pie chart for HackUsNow. Using Tableau, create a tree map using the data in HackUsNow.xlsx. The tree map should show the employees’names and number of hacks to clearly answer the question “Which employees’ computers were hacked the most?”
Showing 100 - 200
of 754
1
2
3
4
5
6
7
8
Step by Step Answers