New Semester
Started
Get
50% OFF
Study Help!
--h --m --s
Claim Now
Question Answers
Textbooks
Find textbooks, questions and answers
Oops, something went wrong!
Change your search query and then try again
S
Books
FREE
Study Help
Expert Questions
Accounting
General Management
Mathematics
Finance
Organizational Behaviour
Law
Physics
Operating System
Management Leadership
Sociology
Programming
Marketing
Database
Computer Network
Economics
Textbooks Solutions
Accounting
Managerial Accounting
Management Leadership
Cost Accounting
Statistics
Business Law
Corporate Finance
Finance
Economics
Auditing
Tutors
Online Tutors
Find a Tutor
Hire a Tutor
Become a Tutor
AI Tutor
AI Study Planner
NEW
Sell Books
Search
Search
Sign In
Register
study help
business
essentials business analytics
Introduction To Business Analytics 1st International Edition Vernon Richardson Marcia, Weidemeier Watson - Solutions
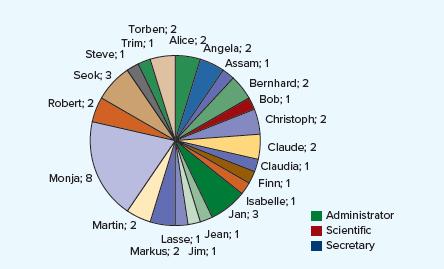
6. (LO 6.1, 6.2, 6.3) Problem 5 presents a pie chart for HackUsNow. Using Tableau, create a bar chart sorted by the number of hacks using the data in HackUsNow.xlsx. Does the bar chart clearly answer the question “Which employees’ computers were hacked the most?”?
5. (LO 6.2, 6.3) The following pie chart shows how frequently each employee’s computer at HackUsNow has been hacked. Evaluate the pie chart assuming that the analyst is trying to answer this question: “Which employees’ computers were hacked the most?”Does the pie chart answer the question?
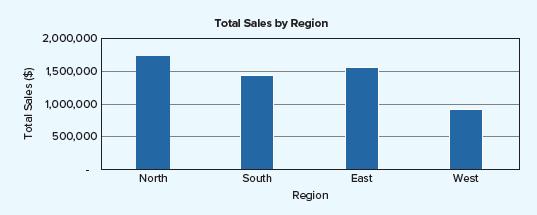
4. (LO 6.3) Examine the data visualization below. Is it a histogram or a bar chart? How can you tell? Total Sales ($) 2,000,000 1,500,000 1,000,000 Total Sales by Region 500,000 North South East West Region
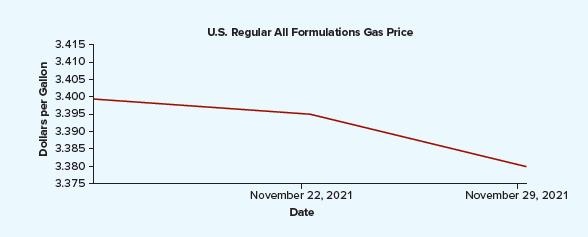
3. (LO 6.5, 6.6) On December 2, 2021, the following graph appeared in a tweet. The graph shows the decline of regular unleaded gas prices in the United States between November 22 and November 29, 2021. Analyze the data visualization with respect to changes in the price of gas. What suggestions, if
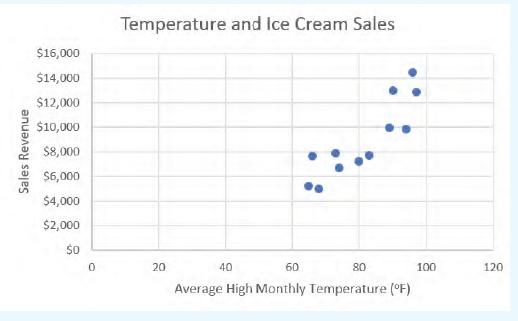
2. (LO 6.4) The following scatterplot shows the relationship between average high monthly temperature (in Fahrenheit) and ice cream sales for a small ice cream stand. The correlation coefficient is 0.87.a. Interpret the correlation value. Is the correlation strong?b. Using the scatterplot,
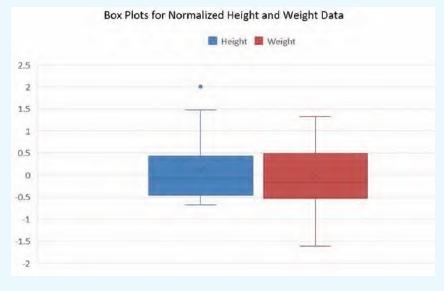
1. (LO 6.3) The following box-and-whisker plots illustrate the heights (blue) and weights (red)of a sample of children. To make it easier to compare the two box plots, the heights and weights of each individual have been normalized or transformed to a z-score, which sets different data sets on the
3. (LO 6.1, 6.2, 6.3, 6.4, 6.5) Match the data visualization with the type of business analytics(descriptive, diagnostic, predictive, or prescriptive) it is most associated with.Data Visualization Type of Business Analytics (Descriptive, Diagnostic, Predictive, or Prescriptive)Scatterplot Times
2. (LO 6.1, 6.2, 6.3, 6.4, 6.5) Match each term with its definition.Term Definition 1. Descriptive statisticsa. The values of two variables, each plotted on its own axis to exhibit possible correlation 2. Trendb. The number of observations in a particular category divided by the grand total of
1. (LO 6.1, 6.2, 6.3, 6.4, 6.5) For each example, which descriptive data visualization is better:a pie chart or a bar chart or line chart?®Example Data Visualization(Pie Chart or Bar/Line Chart)Trend of net income over the past 5 years Proportions (relative sales of each of the company’s
8. (LO 6.1, 6.2) Why are data visualizations a good way to present large amounts of data?
7. (LO 6.5) What is a dashboard? How does it help decision-makers?
6. (LO 6.6) What are the four components of an executive summary? Why is it important to keep the executive summary to one page or less?
5. (LO 6.4) Why is a line chart a good option for visualizing a forecast?
4. (LO 6.3) In what way is a box plot more informative than a histogram?
3. (LO 6.1, 6.2, 6.5) When should you use a table instead of a bar chart?
2. (LO 6.1, 6.2) How does sorting help decision-makers more quickly grasp the information conveyed in a bar chart?
1. (LO 6.2) Why is a bar chart optimal for visualizing numerical data and a pie chart optimal for visualizing categorical data?
17. (LO 6.6) What does the target audience for business analytics help to determine?a. Types of charts usedb. Language and terms usedc. Type of report usedd. Types of charts and reports used as well as the language and terms used
16. (LO 6.5) During weekly executive meetings, a CEO likes to see how visualizations change if different filters are applied to the data. Business analysts who prepare the dashboard do not know ahead of time which filters are needed. Which type of dashboard should business analysts create, so that
15. (LO 6.3) A company is considering a stock investment that is (projected to be) positively skewed. Which of the following statements is correct about the investment?a. The company should expect frequent small losses and a few large gains from the investment.b. The company should expect frequent
14. (LO 6.3) The stock market typically yields a small positive return each day, but intermittently it yields a high negative return on a few days. What type of distribution describes this behavior?a. Negatively skewedb. Symmetricc. Positively skewedd. Uniform
13. (LO 6.2) Assume that Keurig Dr Pepper wants to create a data visualization that compares the total number of cans of Dr Pepper sold in each U.S. state. Which of the following charts is BEST way to present the relative differences in cans sold?a. Bar chartb. Filled geographic mapc. Heat mapd.
12. (LO 6.2) Assume that Keurig Dr Pepper launches a new advertising campaign. To understand the impact of the campaign, the company asks a group of customers to provide three words describing the new campaign. Which of the following charts is the best way to identify the words most frequently used
11. (LO 6.2) Which of the following statements is true?a. Although bar charts can represent counts of categorical data, histograms are used only for numerical data.b. Although histograms can represent counts of categorical data, bar charts are used only for numerical data.c. Although line charts
10. (LO 6.2) When the trend is the most important item to communicate, which of the following statements is true?a. Bar charts are preferable to line charts.b. Line charts are preferable to bar charts.c. Bar charts are preferable to pie charts.d. Pie charts are preferable to line charts.
9. (LO 6.1) What are the individual data observations in a data series called?a. Tick marksb. Data seriesc. Data pointsd. Markers
8. (LO 6.2) Accounting financial statement data, such as sales and net income, are most likely to be shown as which type of data?a. Interval datab. Ratio datac. Nominal datad. Ordinal data
7. (LO 6.3) Which of the following is a data point outside the maximum or minimum value of the expected range of a box plot?a. Outlierb. Medianc. Meand. Variation
6. (LO 6.4) Scatterplots are more meaningful if they include which of the following?a. Times series predictionb. Box plotc. Trend lined. Categorical variable
5. (LO 6.3) Exploratory, diagnostic analytics includes which type of visualizations?a. Box plotsb. Scatterplotsc. Pivot chartsd. Times series graphs
4. (LO 6.4) Which of the following statements is true?a. Scatterplots show values of two variables each plotted on its own axis to exhibit potential trends.b. Scatterplots show values of two variables each plotted on its own axis to exhibit potential correlation.c. Graphs show values of two
3. (LO 6.2) Which of the following data are the values taken on by a variable at different points in time?a. Cross-sectional datab. Categorical datac. Numerical datad. Times series data
2. (LO 6.2) Pie charts lend themselves well to which type of data showing proportions?a. Categoricalb. Numericalc. Diagnosticd. Predictive
1. (LO 6.2) Which of the following statements is true?a. Line charts should be shown only in descending order to emphasize trend.b. Line charts should be shown only in chronological order to emphasize trend.c. Line charts should be shown only in alphabetical order to emphasize proportion.d. Line
1. (LO 5.2) Open the Costs of Moistureshield Production data set in Excel. Analyzing these data will help Moisture Shield, a manufacturer of wood-plastic composite decking, determine its cost structure.Requireda. Use a scatterplot to show the relationship between total production costs and total
9. (LO 5.2) Open the Advertising Expenses and Sales data set in Excel. To complete the requirements in this problem, you will evaluate the association (negative vs. positive)between advertising expenditures and sales revenue. The data set contains the month, the date, the monthly advertising
8. (LO 5.4) Open the To College or Not to College data set in Excel to compare the salary levels (cash flows) of a college graduate. Your goal is to use the data to decide whether or not to get a college degree. In preparation for analyzing the data, answer the following questions.Required 1.
7. (LO 5.2) If you are going to use regression to predict how many factory workers Fox-Conn needs to hire in order to manufacture the next model of the Apple iPhone, what is the dependent (outcome) variable, and what are several relevant independent variables?How would you determine if you have (1)
6. (LO 5.1, 5.4) The cost of a car battery is a major component of the cost of an electric car.Which confirmatory analytics techniques (including prescriptive analytics and predictive analytics) should a business analyst use to answer the following questions?a. What is a battery manufacturer’s
5. (LO 5.4) Suggest operations analytics questions (that is, questions pertaining to the manufacturing and sale of products) that Samsung might address using each of the following prescriptive analytics techniques. (Hint: Use Exhibit 5.3 as a guide.)a. Sensitivity analysisb. Cash flow analysisc.
4. (LO 5.2) How might Netflix classify its customers into segments based on the following?Give examples of each and explain your answers.a. Communication touchpoints (websites, email, snail mail)b. Human touchpoints (interaction with a salesperson or customer service representative)c. Physical
3. (LO 5.2, 5.3) Suggest questions that General Motors might use for each of the following predictive analytics techniques to address. (Hint: Use Exhibits 5.1 and 5.3 as a guide.)a. Classificationb. Regressionc. Time series analysisd. Analysis of base rates
2. (LO 5.4) Identify which prescriptive analytics technique should be used to answer the following questions. Select from cash flow analysis, marginal/incremental analysis, goalseek analysis, or scenario analysis.Example of Prescriptive Analytics Prescriptive Analytics Technique (Cash Flow
1. (LO 5.2) Label each of the following examples of predictive analytics techniques as classification, regression, or time series analysis.Example of Predictive Analytics Classification, Regression, or Time Series?Loan acceptance/loan rejection Interest rate given to borrowers Bankruptcy prediction
3. (LO 5.1, 5.2, 5.4) Label each of the following confirmatory analytics techniques as either predictive or prescriptive analytics.Example of Analytics Technique Performed Predictive Analytics or Prescriptive Analytics?Analysis of whether to manufacture or outsource the manufacture of products
2. (LO 5.2, 5.4, 5.5) Label each of the following as the domain of descriptive, diagnostic, predictive, or prescriptive analytics.Example of Analytics Type of Analytics(Descriptive, Diagnostic, Predictive, or Prescriptive)Benford’s Law Loan acceptance/rejection by bank/lender Sequence check for
1. (LO 5.2, 5.4, 5.5) Label each of the following activities as an example of descriptive, diagnostic, predictive, or prescriptive analytics.®Example of Analytics Type of Analytics(Descriptive, Diagnostic, Predictive, or Prescriptive)Bank reconciliation Fraud or no fraud expected in financial
12. (LO 5.4) How would you set up the scenario analysis for a Chinese company with major exports to the United States if it faces a different level of potential tariffs (import taxes)from the U.S. government? How would the Chinese company consider the potential effect of 10, 25, or 50 percent
11. (LO 5.4) Why is a decision to sell additional units to a customer at a reduced price usually based on marginal analysis?
10. (LO 5.3) Suppose that our analysis predicts that firms will go bankrupt 10 percent of the time, but base rates suggest that over the past 20 years 2 percent of firms have gone bankrupt. Is a base rate fallacy present here? Explain.
9. (LO 5.3) Why do base rates need to be incorporated into a prediction activity?
8. (LO 5.2) Why is persistence an important attribute for time series analysis?
7. (LO 5.2) In a time series analysis predicting future sales, what is the dependent (outcome)variable and what is the independent variable?
6. (LO 5.2) Why is persistence important in using the past to predict the future?
5. (LO 5.2) Why is predicting what interest rate a lender might offer a regression exercise and not a classification activity?
4. (LO 5.2) Why are credit history and credit score good predictors of the interest rate that a bank will charge a borrower?
3. (LO 5.2) Why is a potential borrower’s employment history an important component of a bank’s determination whether to extend a loan to that borrower?
2. (LO 5.2) How is predictive analytics different from descriptive and diagnostic analytics?
1. (LO 5.1) What is the difference between deterministic and probabilistic models? What is the difference between exploratory and confirmatory analytics?
10. (LO 4.3, 4.4) Which has the highest return on investment from 1928 to 2020—the S&P 500, high-grade corporate bonds, or U.S. Treasury bonds? Download the Investment Returns data set in Excel. The source is Aswath Damodaran, NYU Finance Professor, at http://pages.stern.nyu.edu/∼
9. (LO 4.5) Which has the highest return on investment—the S&P 500, high-grade corporate bonds, or U.S. Treasury bonds? Download the Investment Returns data set in Excel.The source is Aswath Damodaran, NYU Finance Professor, at http://pages.stern.nyu.edu/∼
8. (LO 4.4) Download the Unpaid Invoices data set in Excel from Connect. Unpaid invoices refers to the money owed to the company by its debtors (typically its customers). In this problem, we are going to describe the unpaid invoices using different descriptive analytics techniques, including
7. (LO 4.6) Download the data set, Sales Growth Dataset.xlsx, which has sales data(in $millions) for years 20X1 and 20X2 for a set of publicly traded companies over a recent year.Required 1. Format the two Sales columns to two digits.2. Calculate the sales growth using the formula [(New – Old) *
6. (LO 4.4) According to a recent press release (September 2021), “Statistical analyses used to detect fraud in elections held in Third World nations (such as Russia, Venezuela, and Iran) have detected fraud in California resulting in Governor Gavin Newsom being reinstated as governor. The
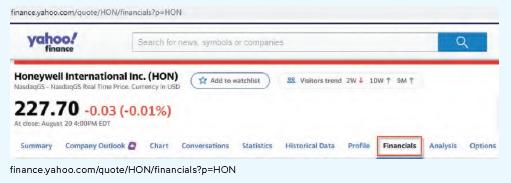
5. (LO 4.4) Go to Yahoo! Finance for Honeywell (HON) (https://finance.yahoo.com/quote/HON/financials?p=HON). Then go to the Financials tab (as shown below) to access the income statement. Perform vertical analysis on Honeywell’s income statement for the two most recent years. What insights can be
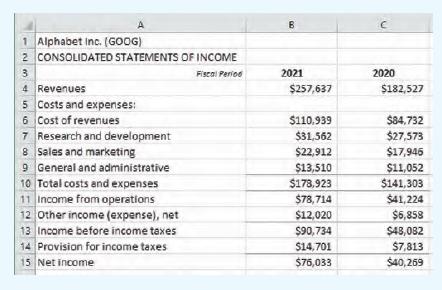
4. (LO 4.4) Using Alphabet Inc. (Google) 2020 and 2021 results (as shown below), perform a horizontal analysis to calculate the change in results from 2020 to 2021.Note: All numbers are in millions.Requireda. Calculate the change in revenues and the percentage change in revenues from 2020 to
3. (LO 4.2) Describe specific types of questions asked in marketing for a specific company of your choice that might require descriptive, diagnostic, predictive, prescriptive, and adaptive/autonomous analytics, with at least one question for each. (Use Exhibit 4.2 as a guide.) Describe specific
2. (LO 4.5) Name the diagnostic analytics technique used to answer the following business questions. Choose from this list: correlation, regression, hypothesis testing.Business Questions Diagnostic Analytics Technique (Correlation, Regression, or Hypothesis Testing)What is the relationship between
1. (LO 4.5) Name the diagnostic test analytics technique used to find each type of anomaly.Choose from these techniques: bank reconciliations, Benford’s Law, fuzzy matching, sequence check, and testing for duplicate transactions.Anomaly Diagnostic Test Approach/Technique Cash transactions
4. (LO 4.6) Match the business analytics technique in Excel’s Data Analysis ToolPak to its use.Business Analytics Technique Use 1. Correlationa. To understand the probability of a statistical difference in averages between two independent samples or between a paired sample through time 2.
3. (LO 4.4, 4.5) Match each analytics type (descriptive or diagnostic) to the techniques used.Technique/Analysis Used Descriptive Analytics or Diagnostic Analytics?Ratio analysis Benford’s Law Percentage change Pivot table to find the most profitable product or customer Sequence check Fuzzy
2. (LO 4.4, 4.5) Match each analytics type (descriptive or diagnostic) to the techniques used.Analytics Technique Used Descriptive Analytics or Diagnostic Analytics?Counts Correlation Sum total Horizontal analysis Regression Standard deviation Vertical analysis Bank reconciliations
1. (LO 4.2) Match the analytics type (descriptive, diagnostic, predictive, prescriptive, adaptive/autonomous) to the question it addresses.Question Analytics Type How can we improve customer satisfaction?What is the expected product demand over the next five years?Why did our competition perform
10. (LO 4.6) Given the role of descriptive analytics in addressing the questions “What happened?”and “What is Happening?” how do the Excel commands SUM(), COUNTIF(), and AVERAGE() help analysts answer those questions?
9. (LO 4.5) How does a bank reconciliation use anomalies and outliers to find items that need to be reconciled? Which type of analytics does a bank reconciliation represent?
8. (LO 4.4, 4.5) Suppose we are interested in investigating whether a social media advertising campaign was more effective than a traditional media campaign in creating additional revenues. To answer this question, which should we use: descriptive analytics or diagnostic analytics? Support your
7. (LO 4.3) Contrast exploratory and confirmatory business analytics. How are they different from each other?
6. (LO 4.2) Which type of analytics works to uncover previously unknown relationships and linkages among variables? Provide an example.
5. (LO 4.2) Which type of analytics emphasizes totals, sums, averages, and sum totals?Provide an example.
4. (LO 4.2) Which type of analytics answers the question “How much in state taxes did the company pay during the previous year?”
3. (LO 4.4) Why is understanding what happened (descriptive analytics) important to understanding why something happened (diagnostic analytics)?
2. (LO 4.2) Describe the differences between predictive analytics and adaptive/autonomous analytics.
1. (LO 4.2) Why does each question that a decision-maker might ask require a different type of analytics (descriptive, diagnostic, predictive, prescriptive, or adaptive/autonomous analytics)?
12. (LO 4.6) Conditional formatting is most often used as a technique in which type of analytics?a. Diagnosticb. Descriptivec. Predictived. Prescriptive
11. (LO 4.3) Which type of analytics is more likely to summarize and explain prior performance.a. Exploratoryb. Probabilisticc. Confirmatoryd. Advanced
10. (LO 4.5) Evaluating an uncertain relationship between advertising expenditures and net income each year is an example ofa. performing drill-down detailed analytics.b. determining relations/patterns/linkages between variables through statistical analysis.c. identifying anomalies/outliers.d.
9. (LO 4.5) According to Benford’s Law, which one of these first digits has a lower probability of occurrence than the first digit “5”?a. 3b. 2c. 4d. 9
8. (LO 4.4) From which system would a company likely get data identifying the customer with the highest dollar amount of orders in the past month?a. Customer relationship management systemb. Accounting systemc. Human resource management systemd. Supply chain management system
7. (LO 4.4) Descriptive analyticsa. summarizes the relevant data.b. uncovers patterns in the relevant data.c. conducts what-if scenarios regarding the relevant data.d. performs cash-flow analysis for the relevant data.
6. (LO 4.4) Which of the following expresses financial information in relation to some relevant figure or base?a. Vertical analysisb. Horizontal analysisc. Ratio analysisd. A pivot table
5. (LO 4.4) In vertical analysis, what is the relevant base for cost of goods sold?a. Net sales revenueb. Total assetsc. Total stockholders’ equityd. Total credit sales
4. (LO 4.4) To compute the percentage change in a horizontal analysis from last year to this year, the formula is:a. (Current Year – Last Year) * 100 / Last Yearb. (Last Year – Current Year) / Last Yearc. (Last Year – Current Year) / Current Yeard. (Current Year – Last Year)/ Current Year
3. (LO 4.2) What type of analytics addresses the question “What happened?”a. Descriptive analyticsb. Diagnostic analyticsc. Predictive analyticsd. Prescriptive analytics
2. (LO 4.5) Which type of question does diagnostic analytics address?a. What happened?b. What should we do based on what we expect will happen?c. Why did it happen?d. Will it happen in the future?
1. (LO 4.2) Which question does predictive analytics address?a. What happened?b. What should we do based on what we expect will happen?c. Why did it happen?d. Will it happen in the future?
1. (LO 3.1, 3.3, 3.5, 3.6, 3.7) Let’s see how using a visualization can assist with data analysis. We will use a transformed version of the data in the file titled Skydio Drone dataset TRANSFORMED.xlsx. This is a transformed version of the data set used in Problems 6–11. This transformed file
11. (LO 3.1, 3.6, 3.7) Management of Skydio thinks that the top 10 SKUs ranked by gross margin have a significantly different average gross margin than the bottom ten SKUs. Using the Data Analysis ToolPak, conduct a hypothesis test using a t-test assuming unequal variances to evaluate the premise.
10. (LO 3.1, 3.2, 3.3, 3.4, 3.5) Let’s filter the data by customer. Make a copy of the data worksheet. Name the new worksheet tab Filter. Create a filter for customer number 3013. Copy the resulting data into row 235 (so you can create descriptive statistics).On the same worksheet, create
9. (LO 3.3, 3.4, 3.5) Let’s analyze the transactions by customer. Create a pivot table in Excel showing how many invoices are associated with each customer. In addition, include a column showing the average gross profit margin percentage for each customer. Use the pivot table to answer the
8. (LO 3.3, 3.4, 3.5) Let’s analyze the transactions by product (SKU). Create a pivot table in Excel showing how many units were sold for each SKU. Use the pivot table to answer the following questions:a. Which product (SKU) sold the most units?b. Which product (SKU) sold the fewest units?c.
Showing 200 - 300
of 754
1
2
3
4
5
6
7
8
Step by Step Answers