New Semester
Started
Get
50% OFF
Study Help!
--h --m --s
Claim Now
Question Answers
Textbooks
Find textbooks, questions and answers
Oops, something went wrong!
Change your search query and then try again
S
Books
FREE
Study Help
Expert Questions
Accounting
General Management
Mathematics
Finance
Organizational Behaviour
Law
Physics
Operating System
Management Leadership
Sociology
Programming
Marketing
Database
Computer Network
Economics
Textbooks Solutions
Accounting
Managerial Accounting
Management Leadership
Cost Accounting
Statistics
Business Law
Corporate Finance
Finance
Economics
Auditing
Tutors
Online Tutors
Find a Tutor
Hire a Tutor
Become a Tutor
AI Tutor
AI Study Planner
NEW
Sell Books
Search
Search
Sign In
Register
study help
business
inferential statistics
Stats Modeling The World AP Edition Grades 9-12 3rd Edition David E. Bock, Paul F. Velleman, Richard D. De Veaux - Solutions
Stats test, part III. The average score on the Stats midterm was 75 points with a standard deviation of 5 points, and Gregor s z-score was How many points did he score?
Horsepower. Cars currently sold in the United States have an average of 135 horsepower, with a standard deviation of 40 horsepower. What s the z-score for a car with 195 horsepower?
Stats test, again. Nicole s score on the Stats midterm was 80 points. The class average was 75 and the standard deviation was 5 points. What was her z-score?
Checkup. One of the authors has an adopted grandson whose birth family members are very short. After examining him at his 2-year checkup, the boy s pediatrician said that the z-score for his height relative to American Median 5 2 ° IQR 5 16 °Mean 5 1 ° Standard deviation 5 7°Maximum temperature
Stats test. Suppose your Statistics professor reports test grades as z-scores, and you got a score of 2.20 on the midterm exam. Write a sentence explaining what that means.
Cold U? A high school senior uses the Internet to get information on February temperatures in the town where he ll be going to college. He finds a Web site with some statistics, but they are given in degrees Celsius. The conversion formula is Determine the Fahrenheit equivalents for the summary
SAT or ACT? Each year thousands of high-school students take either the SAT or the ACT, standardized tests used in the college admissions process. Combined SAT Math and Verbal scores go as high as 1600, while the maximum ACT composite score is 36. Since the two exams use very different scales,
Hams. A specialty foods company sells gourmet hams by mail order. The hams vary in size from 4.15 to 7.45 pounds, with a mean weight of 6 pounds and standard deviation of 0.65 pounds. The quartiles and median weights are 5.6, 6.2, and 6.55 pounds.a) Find the range and the IQR of the weights.b) Do
Payroll. Here are the summary statistics for the weekly payroll of a small company: lowest salary = $300, mean salary = $700, median = $500, range = $1200, IQR = $600, first quartile = $350, standard deviation = $400.a) Do you think the distribution of salaries is symmetric, skewed to the left, or
Hotline. A company s customer service hotline handles many calls relating to orders, refunds, and other issues. The company s records indicate that the median length of calls to the hotline is 4.4 minutes with an IQR of 2.3 minutes.a) If the company were to describe the duration of these calls in
Shipments. A company selling clothing on the Internet reports that the packages it ships have a median weight of 68 ounces and an IQR of 40 ounces.a) The company plans to include a sales flyer weighing 4 ounces in each package. What will the new median and IQR be?b) If the company recorded the
Stereograms, revisited. Because of the skewness of the distributions of fusion times, we might consider a reexpression. Here are the boxplots of the log of fusion times. Is it better to analyze the original fusion times or the log fusion times? Explain.
Stereograms. Stereograms appear to be composed entirely of random dots. However, they contain separate images that a viewer can fuse into a three-dimensional(3D) image by staring at the dots while defocusing the eyes. An experiment was performed to determine whether knowledge of the embedded image
Rainmakers. The table lists the amount of rainfall (in acre-feet) from the 26 clouds seeded with silver iodide discussed in Exercise 38:
Assets again. Here are the same data you saw in Exercise 49 after re-expressions as the square root of assets and the logarithm of assets:a) Which re-expression do you prefer? Why?b) In the square root re-expression, what does the value 50 actually indicate about the company s assets?c) In the
Music library. Students were asked how many songs they had in their digital music library. Here s a display of the responses:a) What aspect of this distribution makes it difficult to summarize, or to discuss, center and spread?b) What would you suggest doing with these data if we want to understand
Assets. Here is a histogram of the assets (in millions of dollars) of 79 companies chosen from the Forbes list of the nation s top corporations:a) What aspect of this distribution makes it difficult to summarize, or to discuss, center and spread?b) What would you suggest doing with these data if we
Sunspots. Sunspots have fascinated people for hundreds of years. (The first recordings of sunspots date from ancient Greece and China.) These dark spots on the sun seem to come and go, and for about 150 years astronomers have noted that there appears to be a cycle.The data set sunspots on the DVD
Hurricanes again 2006. Here are the number of Atlantic hurricanes classified as major for the years 1944 to 2006. (www.nhc.noaa.gov)3, 2, 1, 2, 4, 3, 7, 2, 3, 3, 2, 5, 2, 2, 4, 2, 2, 6, 0, 2, 5, 1, 3, 1, 0, 3, 2, 1, 0, 1, 2, 3, 2, 1, 2, 2, 2, 3, 1, 1, 1, 3, 0, 1, 3, 2, 1, 2, 1, 1, 0, 5, 6, 1, 3, 5,
Drunk driving 2005. Accidents involving drunk drivers account for about 40% of all deaths on the nation s highways. The table tracks the number of alcohol-related fatalities for 24 years. (www.madd.org)
Fruit Flies. Researchers tracked a population of 1,203,646 fruit flies, counting how many died each day for 171 days. Here are three timeplots offering different views of these data. One shows the number of flies alive on each day, one the number who died that day, and the third the mortality rate
Baseball. American League baseball teams play their games with the designated hitter rule, meaning that pitchers do not bat. The League believes that replacing the pitcher, typically a weak hitter, with another player in the batting order produces more runs and generates more interest among fans.
MPG. A consumer organization compared gas mileage figures for several models of cars made in the United States with autos manufactured in other countries. The data are shown in the table:a) Create graphical displays for these two groups.b) Write a few sentences comparing the distributions.
Eye and hair color. A survey of 1021 school-age children was conducted by randomly selecting children from several large urban elementary schools. Two of the questions concerned eye and hair color. In the survey, the following codes were used:
Industrial experiment. Engineers at a computer production plant tested two methods for accuracy in drilling holes into a PC board. They tested how fast they could set the drilling machine by running 10 boards at each of two different speeds. To assess the results, they measured the distance (in
Cholesterol. A study examining the health risks of smoking measured the cholesterol levels of people who had smoked for at least 25 years and people of similar ages who had smoked for no more than 5 years and then stopped. Create appropriate graphical displays for both groups, and write a brief
Law enforcement 2004. Some federal employees have the authority to carry firearms and make arrests. Obviously, some danger is associated with these jobs, but howa) Create a display of these data.b) Describe the data (shape, center, spread, unusual features).c) Which agencies are outliers?
Rainmakers? In an experiment to determine whether seeding clouds with silver iodide increases rainfall, 52 clouds were randomly assigned to be seeded or not.The amount of rain they generated was then measured(in acre-feet). Here are the summary statistics:
Reading scores. A class of fourth graders takes a diagnostic reading test, and the scores are reported by reading grade level. The 5-number summaries for the 14 boys and 11 girls are shown:Boys: 2.0 3.9 4.3 4.9 6.0 Girls: 2.8 3.8 4.5 5.2 5.9a) Which group had the highest score?b) Which group had
Cholesterol. The Framingham Heart Study recorded the cholesterol levels of more than 1400 men. Here is an ogive of the distribution of these cholesterol measures.(An ogive shows the percentage of cases at or below a certain value.) Construct a boxplot for these data and write a few sentences
Derby speeds 2007. How fast do horses run? Kentucky Derby winners top 30 miles per hour, as shown in this graph. The graph shows the percentage of Derby winners that have run slower than each given speed. Note that few have won running less than 33 miles per hour, but about 86% of the winning
SAT scores. Here are the summary statistics for Verbal SAT scores for a high-school graduating class:a) Create parallel boxplots comparing the scores of boys and girls as best you can from the information given.b) Write a brief report on these results. Be sure to discuss the shape, center, and
Caffeine. A student study of the effects of caffeine asked volunteers to take a memory test 2 hours after drinking soda. Some drank caffeine-free cola, some drank regular cola (with caffeine), and others drank a mixture of the two (getting a half-dose of caffeine). Here are the 5-number summaries
Vineyards. Here are summary statistics for the sizes(in acres) of Finger Lakes vineyards:a) Would you describe this distribution as symmetric or skewed? Explain.b) Are there any outliers? Explain.c) Create a boxplot of these data.d) Write a few sentences about the sizes of the vineyards.
Graduation? A survey of major universities asked what percentage of incoming freshmen usually graduate on time in 4 years. Use the summary statistics given to answer the questions that follow.a) Would you describe this distribution as symmetric or skewed? Explain.b) Are there any outliers?
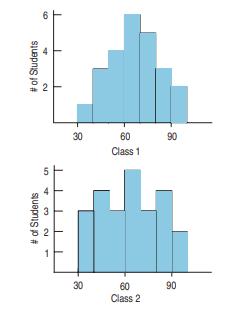
Test scores. Look again at the histograms of test scores for the three Statistics classes in Exercise 29.a) Overall, which class do you think performed best on the test? Why?b) How would you describe the shape of each distribution?c) Match each class with the corresponding boxplot below.
Test scores. Three Statistics classes all took the same test.Histograms of the scores for each class are shown belowa) Which class had the highest mean score?b) Which class had the highest median score?c) For which class are the mean and median most different? Which is higher? Why?d) Which class
Unemployment. In May of 2001, the U.S. Bureau of Labor Statistics (BLS) issued a news release that said, In April, 223 metropolitan areas recorded unemployment rates below the U.S. average of 4.2 percent (not seasonally adjusted), while 99 areas registered higher rates.Sketch what the distribution
Wild-card Summer Olympics. Seventy-one swimmers finished the qualifying first day of the men s 100-m swim in the 2000 Olympics in Sydney. The average time was 52.65 seconds, with a standard deviation of 7.66 seconds. The median time was 51.34 seconds and the IQR was 2.58 seconds.a) Without looking
Ozone. Ozone levels (in parts per billion, ppb) were recorded at sites in New Jersey monthly between 1926 and 1971. Here are boxplots of the data for each month(over the 46 years), lined up in order (January=1):a) In what month was the highest ozone level ever recorded?b) Which month has the
Wines. The boxplots display case prices (in dollars) of varieties of wines produced by vineyards along three of the Finger Lakes:a) Which lake region produces the most expensive wine?b) Which lake region produces the cheapest wine?c) In which region are the wines generally more expensive?d) Write a
Fuel economy III. The Environmental Protection Agency provides fuel economy and pollution information on over 2000 car models. Here is a boxplot of Combined Fuel Economy (using an average of driving conditions) in miles per gallon by whether the car has two- or four-wheel drive. Summarize what you
Fuel economy II. The Environmental Protection Agency provides fuel economy and pollution information on over 2000 car models. Here is a boxplot of Combined Fuel Economy
Fuel economy. Describe what these boxplots tell you about the relationship between the number of cylinders a car s engine has and the car s fuel economy (mpg):
Marriage age. In 1975, did men and women marry at the same age? Here are boxplots of the age at first marriage for a sample of U.S. citizens then. Write a brief report discussing what these data show
Gas prices. Here are boxplots of weekly gas prices at a service station in the Midwestern United States (prices in $ per gallon)a) Compare the distribution of prices over the three years.b) In which year were the prices least stable? Explain.
Women s basketball. Here are boxplots of the points scored during the first 10 games of the season for both Scyrine and Alexandra:a) Summarize the similarities and differences in their performance so far.b) The coach can take only one player to the state championship. Which one should she take? Why?
Deaths 2003. A National Vital Statistics Report(www.cdc.gov/nchs/) indicated that nearly 300,000 black Americans died in 2003 compared with just over 2 million white Americans. Here are histograms displaying the distributions of their ages at death.a) Describe the overall shapes of these
Hospital stays. The U.S. National Center for Health Statistics compiles data on the length of stay by patients in short-term hospitals and publishes its findings in Vital and Health Statistics. Data from a sample of 39 male patients and 35 female patients on length of stay (in days)are displayed in
Camp sites. Shown below are the histogram and summary statistics for the number of camp sites at public parks in Vermont.a) Which statistics would you use to identify the center and spread of this distribution? Why?b) How many parks would you classify as outliers?Explain.c) Create a boxplot for
Population growth. Here is a back-to-back stemand-leaf display that shows two data sets at once one going to the left, one to the right. The display compares the percent change in population for two regions of the United States (based on census figures for 1990 and 2000).The fastest growing states
Tendon transfer II. The point of the tendon transfer experiment described in Exercise 12 was to compare two different surgical procedures: biceps transfers and deltoid transfers. Here are boxplots showing the results. There were 8 surgeries using each procedure:a) Which method had the higher
More cereal. Let s look once more at the sugar content of the cereals described in Exercise 11, The following boxplots compare cereals marketed primarily to adults with children s cereals:a) Are all children s cereals higher in sugar than adult cereals?b) Which group of cereals varies more in sugar
Tendon transfers. People with spinal cord injuries may lose function in some, but not all, of their muscles.The ability to push oneself up is particularly important for shifting position when seated and for transferring into and out of wheelchairs. Surgeons compared two operations to restore the
Cereals. Sugar is a major ingredient in many breakfast cereals. The following boxplot and histogram display the sugar content as a percentage of weight for 49 brands of cereal:a) What is the median sugar content?b) What is the range of the sugar contents of these cereals.c) Describe the shape of
Slalom times. The Men s Combined skiing event consists of a downhill and a slalom. Here are two displays of the slalom times in the Men s Combined of the 2006 Winter Olympics:a) What features of the distribution can you see in both the histogram and the boxplot?b) What features of the distribution
Still rockin . Crowd Management Strategies monitors accidents at rock concerts. In their database, they list the names and other variables of victims whose deaths were attributed to crowd crush at rock concerts. Here are the histogram and boxplot of the victims ages for data from 1999 to 2000a)
Men s Combined. The Men s Combined skiing event consists of a downhill and a slalom. Here are the total times (adding the two race times) for the 2006 Olympics:a) What is the range of these lengths?b) Between what values do the central 50% of these times lie?c) What summary statistics would you use
Golf courses. One measure of the difficulty of a golf course is its length: the total distance (in yards) from tee to hole for all 18 holes. Here are the histogram and summary statistics for the lengths of all the golf courses in Vermont:a) What is the range of these lengths?b) Between what lengths
Costs. To help travelers know what to expect, researchers collected the prices of commodities in 16 cities throughout the world. Here are boxplots comparing the prices of a ride on public transportation, a newspaper, and a cup of coffee in the 16 cities (prices are all in $US).a) On average, which
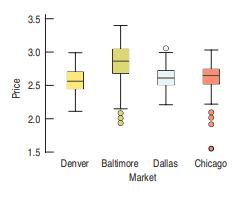
Pizza prices. A company that sells frozen pizza to stores in four markets (Denver, Baltimore, Dallas, and Chicago) in the United States wants to examine the prices that the stores charge for pizza slices. Here are boxplots comparing data from a sample of stores in each market:a) Do prices appear to
Groups on the Internet. Find data on the Internet (or elsewhere) for two or more groups. Make appropriate displays to compare the groups, and interpret what you find.
Time on the Internet. Find data on the Internet (or elsewhere) that give results recorded over time. Make an appropriate display and discuss what it shows.
In the news. Find an article in a newspaper or a magazine that shows a time plot.a) Does the article discuss the W s?b) Is the timeplot appropriate for the data? Explain.c) Discuss what the timeplot reveals about the variable.d) Does the article accurately describe and interpret the data? Explain.
In the news. Find an article in a newspaper or a magazine that compares two or more groups of data.a) Does the article discuss the W s?b) Is the choice of graphics appropriate for the situation?Explain.c) Discuss what the display reveals about the groups.d) Does the article accurately describe and
Zip codes revisited. Here are some summary statistics to go with the histogram of the zip codes of 500 customers from the Holes-R-Us Internet Jewelry Salon that we saw in Exercise 49:a) Is the mean or median a better summary of the center of the zip code distribution? Why?b) Is the standard
Customer database. A philanthropic organization has a database of millions of donors that it contacts by mail to raise money for charities. One of the variables in the database, Title, contains the title of the person or persons printed on the address label. The most common are Mr., Ms., Miss, and
Boomtowns. In 2006, Inc. magazine (www.inc.com)listed its choice of boomtowns in the United States larger cities that are growing rapidly. Here is the magazines top 20, along with their job growth percentages:a) Make a suitable display of the growth rates.b) Summarize the typical growth rate among
Gasoline usage 2004. The California Energy Commission (www.energy.ca.gov/gasoline/) collects data on the amount of gasoline sold in each state. The following data show the per capita (gallons used per person) consumption in the year 2004. Using appropriate graphical displays and summary statistics,
Prisons 2005. A report from the U.S. Department of Justice (www.ojp.usdoj.gov/bjs/) gave the following percent changes in federal prison populations in 20 northeastern and midwestern states during 2005:a) Graph these data.b) Calculate appropriate summary statistics.c) Write a few sentences about
Math scores 2005. The National Center for Education Statistics (http://nces.ed.gov/nationsreportcard/)reported 2005 average mathematics achievement scores for eighth graders in all 50 states:a) Find the median, the IQR, the mean, and the standard deviation of these state averages.b) Which summary
Industry codes. A recently hired investment analyst has been assigned to analyze the companies that make up the Fortune 800, a collection of the largest U.S. companies. He codes each company by the type of industry to which they belong. Here is a table showing some of the industry types and the
Zip codes. Holes-R-Us, an Internet company that sells piercing jewelry, keeps transaction records on its sales. At a recent sales meeting, one of the staff presented a histogram of the zip codes of the last 500 customers, so that the staff might understand where sales are coming from. Comment on
Final grades revisited. After receiving many complaints about his final-grade histogram from students currently taking a Statistics course, the professor from Exercise 47 distributed the following revised histogram:a) Comment on this display.b) Describe the distribution of grades.
Final grades. A professor (of something other than Statistics!) distributed the following histogram to show the distribution of grades on his 200-point final exam. Comment on the display?
Marijuana 2003. In 2003 the Council of Europe published a report entitled The European School Survey Project on Alcohol and Other Drugs (www.espad.org). Among other issues, the survey investigated the percentages of 16-yearolds who had used marijuana. Shown here are the results for 20 European
Acid rain. Two researchers measured the pH (a scale on which a value of 7 is neutral and values below 7 are acidic) of water collected from rain and snow over a 6-month period in Allegheny County, Pennsylvania.Describe their data with a graph and a few sentences:4.57 5.62 4.12 5.29 4.64 4.31 4.30
Return of the birds. Students were given the assignment to make a histogram of the data on bird counts reported in Exercise 40. One student submitted the following displaya) Comment on this graph.b) Create your own histogram of the data.
Home runs, again. Students were asked to make a histogram of the number of home runs hit by Mark McGwire from 1986 to 2001 (see Exercise 39). One student submitted the following displaya) Comment on this graph.b) Create your own histogram of the data.
Horsepower. Create a stem-and-leaf display for these horsepowers of autos reviewed by Consumer Reports one year, and describe the distribution:
Hurricanes 2006. The data below give the number of hurricanes classified as major hurricanes in the Atlantic Ocean each year from 1944 through 2006, as reported by NOAA (www.nhc.noaa.gov):
Bird species. The Cornell Lab of Ornithology holds an annual Christmas Bird Count (www.birdsource.org), in which bird watchers at various locations around the country see how many different species of birds they can spot. Here are some of the counts reported from sites in Texas during the 1999
Home runs. The stem-and-leaf display shows the number of home runs hit by Mark McGwire during the 1986 2001 seasons. Describe the distribution, mentioning its shape and any unusual features.
Wayne Gretzky. In Exercise 34 you examined the number of games played by hockey great Wayne Gretzky during his 20-year career in the NHLa) Would you use the median or the mean to describe the center of this distribution? Why?b) Find the median.c) Without actually finding the mean, would you expect
States. The stem-and-leaf display shows populations of the 50 states and Washington, DC, in millions of people, according to the 2000 census.a) What measures of center and spread are most appropriate?b) Without doing any calculations, which must be larger, the median or the mean? Explain how you
How tall? Students in a large class were asked to estimate the teacher s height in inches. Here s a histogram of their estimates:You want a good guess of the professor s true height (or at least a good guess of how tall the students think the professor is). How would you summarize these data?Why?
Sip size. Researchers in Cornell University s Food Sciences department study how people experience foods.One study considered how much liquid people typically take into their mouths in one sip (in milliliters). The researchers also recorded the height (meters) and weight(kilograms) of the
The Great One. During his 20 seasons in the NHL, Wayne Gretzky scored 50% more points than anyone who ever played professional hockey. He accomplished this amazing feat while playing in 280 fewer games than Gordie Howe, the previous record holder. Here are the number of games Gretzky played during
Gasoline. In March 2006, 16 gas stations in Grand Junction, Colorado, posted these prices for a gallon of regular gasoline:a) Make a stem-and-leaf display of these gas prices. Use split stems; for example, use two 2.2 stems, one for prices between $2.20 and $2.24, the other for prices from $2.25 to
Singers. The frequency table shows the heights (in inches) of 130 members of a choir.a) Find the median and IQR.b) Find the mean and standard deviation.c) Display these data with a histogram.d) Write a few sentences describing the distribution of heights.
Payroll. A small warehouse employs a supervisor at$1200 a week, an inventory manager at $700 a week, six stock boys at $400 a week, and four drivers at $500 a week.a) Find the mean and median wage.b) How many employees earn more than the mean wage?c) Which measure of center best describes a typical
Standard deviation II. For each lettered part, a throughc, examine the two given sets of numbers. Without doing any calculations, decide which set has the larger standard deviation and explain why. Then check by finding the standard deviations by hand.
Standard deviation I. For each lettered part, a throughc, examine the two given sets of numbers. Without doing any calculations, decide which set has the larger standard deviation and explain why. Then check by finding the standard deviations by hand.
Sick days. During contract negotiations, a company seeks to change the number of sick days employees may take, saying that the annual average is 7 days of absence per employee. The union negotiators counter that the average employee misses only 3 days of work each year. Explain how both sides might
Movie budgets. The histogram shows the budgets (in millions of dollars) of major release movies in 2005.An industry publication reports that the average movie costs $35 million to make, but a watchdog group concerned with rising ticket prices says that the average cost is $46.8 million. What
Cold weather. A meteorologist preparing a talk about global warming compiled a list of weekly low temperatures(in degrees Fahrenheit) he observed at his southern Florida home last year. The coldest temperature for any week was 36°F but he inadvertently recorded the Celsius value of 2°.Assuming
Mistake. A clerk entering salary data into a company spreadsheet accidentally put an extra 0 in the boss s salary, listing it as $2,000,000 instead of $200,000. Explain how this error will affect these summary statistics for the company payroll:a) measures of center: median and mean.b) measures of
More summaries. Here are the annual numbers of deaths from tornadoes in the United States from 1990 through 2000 (www.noaa.gov):53 39 39 33 69 30 25 67 130 94 40 Find these statistics by hand (no calculator!):a) meanb) median and quartilesc) range and IQR
Summaries. Here are costs of 10 electric smoothtop ranges rated very good or excellent by Consumer Reports in August 2002:$850 900 1400 1200 1050 1000 750 1250 1050 565 Find these statistics by hand (no calculator!):a) meanb) median and quartilesc) range and IQR
Golf drives. The display shows the average drive distance (in yards) for 202 professional golfers on the men s PGA tour.a) Describe this distribution.b) Approximately what proportion of professional male golfers drive, on average, less than 280 yards?c) Estimate the mean by examining the
Showing 4400 - 4500
of 4734
First
34
35
36
37
38
39
40
41
42
43
44
45
46
47
48
Step by Step Answers