New Semester
Started
Get
50% OFF
Study Help!
--h --m --s
Claim Now
Question Answers
Textbooks
Find textbooks, questions and answers
Oops, something went wrong!
Change your search query and then try again
S
Books
FREE
Study Help
Expert Questions
Accounting
General Management
Mathematics
Finance
Organizational Behaviour
Law
Physics
Operating System
Management Leadership
Sociology
Programming
Marketing
Database
Computer Network
Economics
Textbooks Solutions
Accounting
Managerial Accounting
Management Leadership
Cost Accounting
Statistics
Business Law
Corporate Finance
Finance
Economics
Auditing
Tutors
Online Tutors
Find a Tutor
Hire a Tutor
Become a Tutor
AI Tutor
AI Study Planner
NEW
Sell Books
Search
Search
Sign In
Register
study help
business
intermediate microeconomics
Microeconomics 7th Edition Jeffrey M. Perloff - Solutions
3.8 A monopoly with a constant marginal cost m has a profit-maximizing price of p1. It faces a constant elasticity demand curve with elasticity ε. After the government applies a specific tax of $1, its price is p2. What is the price change p2 - p1 in terms of ε?How much does the price rise if the
3.7 If the inverse demand function facing a monopoly is p(Q) and its cost function is C(Q), show the effect of a specific tax, t, on its profit-maximizing output.How does imposing t affect its profit? (Hint: See Solved Problem 11.4.) C
3.6 Show that a monopoly will not necessarily lower its price by the same percentage as its constant marginal cost drops. (Hint: See Solved Problem 11.4.)
3.5 Show mathematically that a monopoly may raise the price to consumers by more than the specific tax t imposed on it. (Hints: Consider a monopoly facing a constant-elasticity demand curve and a constant marginal cost, m. See Solved Problem 11.4.)
3.4 If the inverse demand curve is p = 120 - Q and the marginal cost is constant at 10, how does charging the monopoly a specific tax of t = 10 per unit affect the monopoly optimum and the welfare of consumers, the monopoly, and society (where society’s welfare includes the tax revenue)? What is
3.3 Only Native American Indian tribes can run casinos in California. These casinos are spread around the state so that each is a monopoly in its local community. Then California Governor Arnold Schwarzenegger negotiated with the state’s tribes, getting them to agree to transfer 10% of their
3.2 What is the effect of a franchise (lump-sum) tax on a monopoly? (Hint: Consider the possibility that the firm may shut down.) (Hint: See Solved Problem 11.4.)
3.1 A monopoly has a constant marginal cost of production of $1 per unit and a fixed cost of $10.Draw the firm’s MC, AVC, and AC curves. Add a downward-sloping demand curve, and show the profit-maximizing quantity and price. Indicate the profit as an area on your diagram. Show the deadweight
2.10 The U.S. Postal Service (USPS) has a constitutionally guaranteed monopoly on first-class mail.In 2012, it charged 44¢ for a stamp, which was not the profit-maximizing price—the USPS’s goal, allegedly, is to break even rather than to turn a profit. Following the postal services in
2.9 According to one estimate, the parts for a Segway Human Transporter—which has five gyroscopes, two tilt sensors, dual redundant motors, ten microprocessors, and can travel up to 12.5 mph—cost at least $1,500 (Eric A. Taub, “Segway Transporter Slow to Catch On,” San Francisco Chronicle,
2.8 According to iSuppli (HIS) in 2010, its sixthgeneration iPod nano’s marginal cost is about $45, while its price is about $150. What is Apple’s price/marginal cost ratio? What is its Lerner Index? If we assume (possibly incorrectly) that Apple acts like a short-run profit-maximizing monopoly
2.7 In 2009, the price of Amazon’s Kindle 2 was $359, while iSuppli (HIS) estimated that its marginal cost was $159. What was Amazon’s Lerner Index? What elasticity of demand did it face if it was engaging in short-run profit maximization? (Hint: See Solved Problem 11.3.)
2.6 Using the information in Solved Problem 11.2, calculate the elasticity of demand for the iPad at the profit-maximizing solution using its inverse demand curve. Compare that answer to the one we obtained in Solved Problem 11.3 using the Lerner Index formula.
2.5 Suppose that the inverse demand for San Francisco cable car rides is p = 10 - Q/1,000, where p is the price per ride and Q is the number of rides per day, and that the objective of San Francisco’s Municipal Authority (the cable car operator) is to maximize its revenues. What is the
2.4 Draw an example of a monopoly with a linear demand curve and a constant marginal cost curve.a. Show the profit-maximizing price and output, p*and Q*, and identify the areas of consumer surplus, producer surplus, and deadweight loss. Also show the quantity, Qc, that would be produced if the
2.3 When will a monopoly set its price equal to its marginal cost?
2.2 Why is the ratio of the monopoly’s price to its marginal cost, p/MC, smaller, the less elastic the demand curve at the optimum quantity? Can the demand curve be inelastic at that quantity?
2.1 Are major-league baseball clubs profit-maximizing monopolies? Some observers of this market have contended that baseball club owners want to maximize attendance or revenue. Alexander (2001)says that one test of whether a firm is a profitmaximizing monopoly is to check whether the firm is
1.15 In 2013, the Oakland A’s were one of the hottest teams in baseball. They were regularly drawing“sellout” crowds, with many more fans wanting tickets. However, the A’s do not sell all of the 56,000 seats. The A’s have removed or put tarps over roughly 20,000 seats in most of the third
1.14 Show that after a shift in the demand curve, a monopoly’s price may remain constant but its output may rise.
1.13 A monopoly manufactures its product in two factories with marginal cost functions MC1(Q1) and MC2(Q2), where Q1 is the quantity produced in the first factory and Q2 is the quantity manufactured in the second factory. The monopoly’s total output is Q = Q1 + Q2. Use a graph or math to
1.12 The inverse demand curve a monopoly faces is p = 10Q-0.5. The firm’s cost curve is C(Q) = 5Q.What is the profit-maximizing solution? (Hint: See Solved Problem 11.2.) C
1.11 The inverse demand curve a monopoly faces is p = 100 - Q. The firm’s cost curve is C(Q) = 10 + 5Q (so MC = 5). What is the profit-maximizing solution? How does your answer change if C(Q) = 100 + 5Q? (Hint: See Solved Problem 11.2.) A
1.10 Show why a monopoly may operate in the upwardor downward-sloping section of its long-run average cost curve but a competitive firm will operate only in the upward-sloping section.
1.9 AT&T Inc., the large U.S. phone company and the one-time monopoly, left the payphone business at the beginning of 2009 because people were switching to wireless phones. U.S. consumers owning cellphones reached 80% by 2007 and 86% by 2012 according to the Pew Research Center (2013).The number of
1.8 Under what conditions is a monopoly unlikely to be profitable in the long run? (Hint: Discuss the relationship between market demand and average cost.)
1.7 If the inverse demand function is p = 500 - 10Q, what is the elasticity of demand and revenue at Q = 10?
1.6 Does a monopoly’s profit differ if it chooses price or quantity (assuming it chooses them optimally)?Why can’t a monopoly choose both price and quantity?
1.5 The demand curve Q = A/p, where A is a positive constant, has the property that the elasticity of demand is ε = -1. If a monopoly faces this demand curve, where would it set its price or quantity if it has a positive marginal cost? Explain. Is this situation plausible?
1.4 The demand curve Q = A/p, where A is a positive constant, has the property that the elasticity of demand is ε = -1 everywhere.a. Use math to show that the revenue is the same at any given point on the constant elasticity of demand curve. Cb. Show that, for any point on the constant elasticity
1.3 A demand curve Q = A/p, where A is a positive constant, has the property that the elasticity of demand is ε = -1. Accurately draw this demand curve. Now pick two different prices and show the associated revenue for each. (Draw a line from a given price on the vertical axis horizontally to the
1.2 If the inverse demand curve a monopoly faces is p = 10Q-0.5, what is the firm’s marginal revenue curve? (Hint: See Solved Problem 11.1.) C
1.1 If the linear inverse demand function is p = 100 - 2Q, what is the marginal revenue function? Draw the demand and marginal revenue curves. (Hint: See Solved Problem 11.1) A
How did the presence of me-too rival products produced by firms with higher marginal costs affect Apple’s iPod pricing in more recent years? Assume that Apple has a constant marginal cost MC. The large number of identical, higher-cost rivals—the competitive fringe—act like (competitive) price
In the linear example in panel a of Figure 11.3, how does charging the monopoly a specific tax of t = 8 per unit affect the monopoly optimum and the welfare of consumers, the monopoly, and society (where society’s welfare includes the tax revenue)?What is the incidence of the tax on consumers?
When the iPad was introduced, Apple’s constant marginal cost of producing this iPad was about $220. We estimate that its average cost was about AC = 220 + 2,000/Q, and that Apple’s inverse demand function for the iPad was p = 770 - 11Q, where Q is measured in millions of iPads purchased.8 What
6.2 Peaches are sold in a competitive market to two types of demanders: consumers who eat fresh peaches and firms that can them. If the government places a binding price ceiling on only peaches sold directly to consumers, what happens to prices and quantities sold for each use?
6.1 Modify the figure in the Challenge Solution to show how much would be sold in both sectors in the absence of anti-price gouging laws. Discuss how these quantities differ from those that result from implementing such laws.
5.3 Suppose that society used the “opposite” of a Rawlsian welfare function: It tried to maximize the wellbeing of the best-off member of society. Write this welfare function. What allocation maximizes welfare in this society?
5.2 Give an example of a social welfare function that leads to the egalitarian allocation that everyone should be given exactly the same bundle of goods.
5.1 A society consists of two people with utilities U1 and U2, and the social welfare function is W = α1U1 + α1U2. Draw a utility possibility frontier similar to the ones in Figure 10.9. When social welfare is maximized, show that as α1/α2 increases, Person 1 benefits and Person 2 is harmed. A
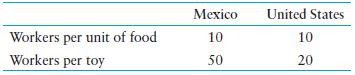
4.6 Mexico and the United States can both produce food and toys. Mexico has 100 workers and the United States has 300 workers. If they do not trade, the United States consumes 10 units of food and 10 toys, and Mexico consumes 5 units of food and 1 toy. The following table shows how many workers are
4.5 Modify Solved Problem 10.4 to show that the PPF more closely approximates a quarter of a circle with five people. One of these new people, Bill, can produce five cords of wood, or four candy bars, or any linear combination. The other, Helen, can produce four cords of wood, or five candy bars,
4.4 If Jane and Denise have identical, linear production possibility frontiers, can they benefit by trading?Why? (Hint: See Solved Problem 10.4.)
4.3 Pat and Chris can spend their nonleisure time working either in the marketplace or at home(preparing dinner, taking care of children, doing repairs). In the marketplace, Pat earns a higher wage, wp = $20, than Chris, wc = $10. Discuss how living together is likely to affect how much each of
4.2 Suppose that Britain can produce 10 units of cloth or 5 units of food per day (or any linear combination)with available resources and Greece can produce 2 units of food per day or 1 unit of cloth (or any combination). Britain has an absolute advantage over Greece in producing both goods. Does
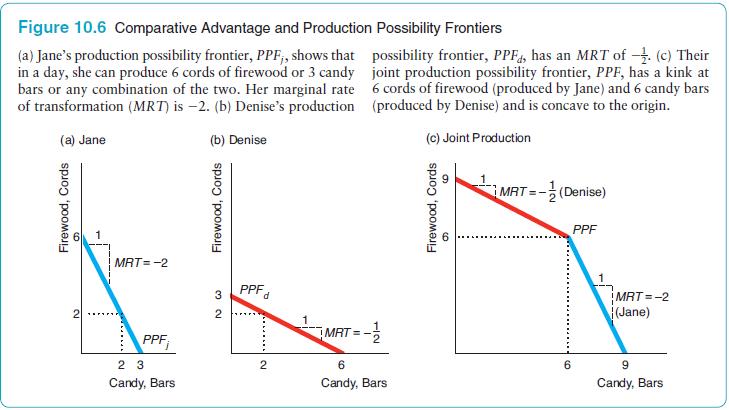
4.1 In panel c of Figure 10.6, the joint production possibility frontier is concave to the origin. When the two individual production possibility frontiers are combined, however, the resulting PPF could have been drawn so that it was convex to the origin.How do we know which of these two ways of
3.1 In an Edgeworth box, illustrate that a Paretoefficient equilibrium, pointa, can be obtained by competition, given an appropriate endowment. Do so by identifying an initial endowment point, b, located somewhere other than at pointa, such that the competitive equilibrium (resulting from
2.6 Explain why point e in Figure 10.4 is not on the contract curve. (Hint: See Solved Problem 10.3.)
2.5 Adrienne and Sarah consume pizza, Z, and cola, C. Adrienne’s utility function is UA = ZACA, and Sarah’s is Z0.5 D C0.5 D . Adrienne’s marginal utility of pizza is MUZA= CA.Similarly, MUAC= ZA, MUDZ= 12 Z-0.5 D C0.5 D , and MUDC= 12 Z0.5 D C-0.5 D . Their endowments are ZA = 10, CA = 20,
2.4 In a pure exchange economy with two goods, G and H, the two traders have Cobb-Douglas utility functions. Amos’ utility is Ua = (Ga)α(Hα)1 - αand Elise’s is Ue = (Ge)β(He)1 - β. What are their marginal rates of substitution? Between them, Amos and Elise own 100 units of G and 50 units
2.3 Two people trade two goods that they cannot produce.Suppose that one consumer’s indifference curves are bowed away from the origin—the usual type of curves—but the other’s are concave to the origin. In an Edgeworth box, show that a point of tangency between the two consumers’
2.2 Two people in a pure exchange economy have identical utility functions. Will they ever want to trade?
2.1 Initially, Michael has 10 candy bars and 5 cookies, and Tony has 5 candy bars and 10 cookies. After trading, Michael has 12 candy bars and 3 cookies.In an Edgeworth box, label the initial Allocation A and the new Allocation B. Draw some indifference curves that are consistent with this trade
1.11 For years, Buffalo wings, barbequed chicken wings, have been popular at bars and restaurants, especially during football season. Now, restaurants across the country are selling boneless wings, a small chunk of chicken breast that is fried and smothered in sauce. Part of the reason for this
1.10 Philadelphia collects an ad valorem tax on its residents’ earnings (see the Application “Urban Flight”), unlike the surrounding areas. Show the effect of this tax on the equilibrium wage, total employment, employment in Philadelphia, and employment in the surrounding areas. (Hint: See
1.9 The demand curve in Sector 1 of the labor market is L1 = a - bw. The demand curve in Sector 2 is L2 = c - dw. The supply curve of labor for the entire market is L = e + fw. In equilibrium, L1 + L2 = L.a. Solve for the equilibrium with no minimum wage.b. Solve for the equilibrium at which the
1.8 A competitive industry with an upward-sloping supply curve sells Qh of its product in its home country and Qf in a foreign country, so the total quantity it sells is Q = Qh + Qf. No one else produces this product. Shipping is costless. Determine the equilibrium price and quantity in each
1.7 Competitive firms located in Africa sell their output only in Europe and the United States (which do not produce the good themselves). The industry’s supply curve is upward sloping. Europe puts a tariff of t per unit on the good but the United States does not. What is the effect of the tariff
1.6 Suppose that the government gives a fixed subsidy of T per firm in one sector of the economy to encourage firms to hire more workers. What is the effect on the equilibrium wage, total employment, and employment in the covered and uncovered sectors?(Hint: See Solved Problem 10.2.)
1.5 Initially, all workers are paid a wage of w1 per hour.The government taxes the cost of labor by t per hour only in the “covered” sector of the economy(if the wage received by workers in the covered sector is w2 per hour, firms pay w2 + t per hour).Show how the wages in the covered and
1.4 What is the effect of a subsidy of s per hour on labor in only one sector of the economy on the equilibrium wage, total employment, and employment in the covered and uncovered sectors? (Hint:See Solved Problem 10.2.)
1.3 A central city imposes a rent control law that places a binding ceiling on the rent that can be charged for an apartment. The suburbs of this city do not have a rent control law. What happens to the rental prices in the suburbs and to the equilibrium number of apartments in the total
1.2 The demand functions for each of two goods depend on the prices of the goods, p1 and p2: Q1 = 15 - 3p1 + p2 and Q2 = 6 - 2p2 + p1.However, each supply curve depends on only its own price: Q1 = 2 + p1 and Q2 = 1 + p2. Solve for the equilibrium: p1, p2, Q1, and Q2. (Hint: See Solved Problem
We can use a multimarket model to analyze the Challenge questions about the effects of a binding price ceiling that applies to some states but not to others. The figure shows what happens if a binding price ceiling is imposed in the covered sector—those states that have anti-price gouging
How does the joint production possibility frontier for Jane and Denise in panel c of Figure 10.6 change if they can also trade with Harvey, who can produce 5 cords of wood, 5 candy bars, or any linear combination of wood and candy in a day? Figure 10.6 Comparative Advantage and Production
Are allocations a and g in Figure 10.4 part of the contract curve? 12. Figure 10.4 Contract Curve The contract curve contains all the Pareto-efficient allocations. Any bundle for which Jane's indifference curve is tangent to Denise's indiffer- ence curve lies on the contract curve. At such a
After the government starts taxing the cost of labor by t per hour in a covered sector only, the wage that workers in both sectors receive is w, but the wage paid by firms in the covered sector is w + t. What effect does the subsidy have on the wages, total employment, and employment in the covered
Because many consumers choose between coffee and tea, the coffee and tea demand functions depend on both prices. Suppose the demand curves for coffee and tea are Qc = 120 - 2pc + pt, Qt = 90 - 2pt + pc, where Qc is the quantity of coffee, Qt is the quantity of tea, pc is the price of coffee, and pt
8.1 The U.S. National Park Service wants to restrict the number of visitors to Yosemite National Park to Q*, which is fewer than the current volume.It considers two policies: (a) raising the price of admissions and (b) setting a quota that limits the number of visits by in-state residents. Compare
7.9 The U.S. Supreme Court ruled in May 2005 that people can buy wine directly from out-of-state vineyards. Previously, some states had laws that required people to buy directly from wine retailers located in the state.a. Suppose the market for wine in New York is perfectly competitive both before
7.8 Canada has 20% of the world’s known freshwater resources, yet many Canadians believe that the country has little or none to spare. Over the years, U.S. and Canadian firms have struck deals to export bulk shipments of water to droughtafflicted U.S. cities and towns. Provincial leaders have
7.7 After Mexico signed the North American Free Trade Agreement (NAFTA) with the United States in 1994, corn imports from the United States doubled within a year, and, in some recent years, U.S.imports have approached half of the amount of corn consumed in Mexico. According to Oxfam(2003), the
7.6 During the Napoleonic Wars, Britain blockaded North America, seizing U.S. vessels and cargo and impressing sailors. At President Thomas Jefferson’s request, Congress imposed a nearly complete—perhaps 80%—embargo on international commerce from December 1807 to March 1809. Just before the
7.5 A government is considering a quota or a tariff, both of which will reduce imports by the same amount. Which does the government prefer, and why? Explain how your answer depends on the way that the quota is allocated.
7.4 In the first quarter of 2013, the world price for raw sugar, 23¢ per pound, was about 79% of the domestic price, 29¢ per pound, because of quotas and tariffs on sugar imports. Consequently, U.S.-made corn sweeteners can be profitably sold domestically. A decade ago, the U.S. Commerce
7.3 In 2013, the United States accused India, China, and three other Asian countries of dumping shrimp in the United States at prices below their costs, and proposed duties (tariffs) as high as 62.74% (Uttara Choudhury, “U.S. Sets Preliminary Anti-dumping Duties on Indian Shrimp,” FirstPost
7.2 Given that the world supply curve is horizontal at the world price for a given good, can a subsidy on imports raise welfare in the importing country?Explain your answer.
7.1 Show that if the importing country faces an upward-sloping foreign supply curve (excess supply curve), a tariff may raise welfare in the importing country.
6.14 Suppose that the demand curve is Q = 100 - 10p and the supply curve is Q = 10p. The government imposes a price ceiling of p = 3.a. Describe how the equilibrium changes.b. What effect does this ceiling have on consumer surplus, producer surplus, and deadweight loss?(Hint: See Solved Problem
6.13 A mayor wants to help renters in her city. She considers two policies that will benefit renters equally. One policy is rent control, which places a price ceiling, p, on rents. The other is a government housing subsidy of s dollars per month that lowers the amount renters pay (to p). Who
6.12 The government sets a minimum wage above the current equilibrium wage. What effect does the minimum wage have on the market equilibrium?What are its effects on consumer surplus, producer surplus, and total surplus? Who are the consumers and who are the producers? (Hint: See the treatment of a
6.11 Suppose that the demand curve for wheat is Q = 100 - 10p and the supply curve is Q = 10p.The government imposes a price support at p = 6 using a deficiency payment program.a. What are the quantity supplied, the price that clears the market, and the deficiency payment?b. What effect does this
6.10 Use diagrams to compare the welfare implications of the traditional agricultural price support program and the deficiency payment program if both set the same price floor, p. Under what circumstances would farmers, consumers, or taxpayers prefer one program to the other? (Hint: See Solved
6.9 Suppose that the demand curve for wheat is Q = 100 - 10p and the supply curve is Q = 10p.The government provides producers with a specific subsidy of s = 1 per unit.a. How do the equilibrium price and quantity change?b. What effect does this tax have on consumer surplus, producer surplus,
6.8 The government wants to drive the price of soybeans above the equilibrium price, p1, to p2. It offers growers a lump-sum payment of x to reduce their output from Q1 (the equilibrium level) to Q2, which is the quantity demanded by consumers at p2. Use a figure to show how large x must be (an
6.7 What is the long-run welfare effect of a profit tax(the government collects a specified percentage of a firm’s profit) assessed on each competitive firm in a market?
6.6 What is the welfare effect of a lump-sum tax, L, assessed on each competitive firm in a market?(Hint: See Chapter 8.)
6.5 In Solved Problem 9.4, what is the relationship between lost consumer surplus due to the tax, deadweight loss, and tax revenue? Discuss and reconcile the different results in Solved Problems 9.1 and 9.4.
6.4 How would the analysis in Solved Problem 9.4 change if the supply curve were upward-sloping instead of horizontal?
6.3 What is the welfare effect of an ad valorem sales tax,α, assessed on each competitive firm in a market?
6.2 Suppose that the demand curve for wheat is Q = 100 - 10p and the supply curve is Q = 10p.The government imposes a specific tax of t = 1 per unit.a. How do the equilibrium price and quantity change?b. What effect does this tax have on consumer surplus, producer surplus, government revenue,
6.1 If the inverse demand function for books is p = 60 - Q and the supply function is Q = p, what is the initial equilibrium? What is the welfare effect of a specific tax of t = $2? A
5.4 Although 23 states barred the self-service sale of gasoline in 1968, most removed the bans by the mid-1970s. By 1992, self-service outlets sold nearly 80% of all U.S. gas. By 2013, only New Jersey and Oregon continued to ban self-service sales. Using predicted values for self-service sales for
5.3 In 2012, two Oakland City Council members called for slashing the annual fees the city charges for taxi medallions from $1,019 a year to $510 (Matthai Kuruvila, “Cheaper Oakland Taxi Medallions Proposed,”San Francisco Chronicle, December 17, 2012). They say that they want to help cab
5.2 A city may limit the number of cabs in many ways.The most common method is an explicit quota using a medallion that is kept forever and can be resold. One alternative is to charge a high license fee each year, which is equivalent to the city’s issuing a medallion or license that lasts only a
5.1 In 2002, Los Angeles imposed a ban on new billboards, which was upheld by the courts in 2009, and new digital billboards were shut down by court order in 2013. Owners of existing billboards did not oppose the initial ban. Why? What are the implications of the ban for producer surplus, consumer
4.2 Use an indifference curve diagram (gifts on one axis and all other goods on the other) to illustrate that one is better off receiving cash than a gift.(Hint: See the discussion of gifts in this chapter and the discussion of food stamps in Chapter 4.)Relate your analysis to the “Deadweight
3.2 If the supply function is Q = 10 + p, what is the producer surplus if price is 20? (Hint: See Solved Problem 9.2.)
3.1 For a firm, how does the concept of producer surplus differ from that of profit if it has no fixed cost?
Showing 2300 - 2400
of 5625
First
17
18
19
20
21
22
23
24
25
26
27
28
29
30
31
Last
Step by Step Answers