New Semester
Started
Get
50% OFF
Study Help!
--h --m --s
Claim Now
Question Answers
Textbooks
Find textbooks, questions and answers
Oops, something went wrong!
Change your search query and then try again
S
Books
FREE
Study Help
Expert Questions
Accounting
General Management
Mathematics
Finance
Organizational Behaviour
Law
Physics
Operating System
Management Leadership
Sociology
Programming
Marketing
Database
Computer Network
Economics
Textbooks Solutions
Accounting
Managerial Accounting
Management Leadership
Cost Accounting
Statistics
Business Law
Corporate Finance
Finance
Economics
Auditing
Tutors
Online Tutors
Find a Tutor
Hire a Tutor
Become a Tutor
AI Tutor
AI Study Planner
NEW
Sell Books
Search
Search
Sign In
Register
study help
business
intro stats
Stats Data And Models 4th Global Edition Richard D. De Veaux, Paul Velleman, David E. Bock - Solutions
Drug abuse revisited In the exercises of the last chapter, you examined results of a survey conducted in the United States and 10 countries of Western Europe to determine the percentage of teenagers who had used marijuana and other drugs. Below is the scatterplot. Summary statistics showed that the
Used cars 2014 Carmax.com lists numerous Toyota Corollas for sale within a 250 mile radius of Redlands, CA. Listed at the top of the next column are the ages of the cars and the advertised prices.a) Make a scatterplot for these data.b) Describe the association between Age and Price of a used
Wildfires 2012—sizes We saw in Exercise 57 that the number of fires was nearly constant. But has the damage they cause remained constant as well? Here’s a regression that examines the trend in Acres per Fire,(in hundreds of thousands of acres) together with some supporting plots:a) Is the
Wildfires 2012 The National Interagency Fire Center(www.nifc.gov) reports statistics about wildfires. Here’s an analysis of the number of wildfires between 1985 and 2012.a) Is a linear model appropriate for these data? Explain.b) Interpret the slope in this context.c) Can we interpret the
Success, part 2 Based on the statistics for college freshmen given in Exercise 54, what SAT score would you predict for a freshmen who attained a first-semester GPA of 3.0?
SAT, take 2 Suppose we wanted to use SAT math scores to estimate verbal scores based on the information in Exercise 53.a) What is the correlation?b) Write the equation of the line of regression predicting verbal scores from math scores.c) In general, what would a positive residual mean in this
Success in college Colleges use SAT scores in the admissions process because they believe these scores provide some insight into how a high school student will perform at the college level. Suppose the entering freshmen at a certain college have mean combined SAT Scores of 1222, with a standard
SAT scores The SAT is a test often used as part of an application to college. SAT scores are between 200 and 800, but have no units. Tests are given in both Math and Verbal areas. SAT-Math problems require the ability to read and understand the questions, but can a person’s verbal score be used
Online clothes II For the online clothing retailer discussed in the previous problem, the scatterplot of Total Yearly Purchases by Income looks like this:The correlation between Total Yearly Purchases and Income is 0.722. Summary statistics for the two variables are:a) What is the linear regression
Online clothes An online clothing retailer keeps track of its customers’ purchases. For those customers who signed up for the company’s credit card, the company also has information on the customer’s Age and Income A random sample of 500 of these customers shows the following scatterplot of
Interest rates and mortgages 2013 again In Chapter 6, Exercise 40, we saw a plot of mortgages in the United States (in trillions of 2013 dollars) vs. the interest rate at various times over the past 25 years. The correlation is r = -0.80. The mean mortgage amount is $3.926 T and the mean interest
Income and housing revisited In Chapter 6, Exercise 39, we learned that the Office of Federal Housing Enterprise Oversight (OFHEO) collects data on various aspects of housing costs around the United States. Here’s a scatterplot(by state) of the Housing Cost Index (HCI) vs.the Median Family Income
Attendance 2013, last inning Refer again to the regression analysis for average attendance and games won by American League baseball teams, seen in Exercise 44.a) Write the equation of the regression line.b) Estimate the Average Attendance for a team with 50 Wins.c) Interpret the meaning of the
Last cigarette Take another look at the regression analysis of tar and nicotine content of the cigarettes in Exercise 43.a) Write the equation of the regression line.b) Estimate the Nicotine content of cigarettes with 4 milligrams of Tar.c) Interpret the meaning of the slope of the regression line
Attendance 2013, revisited Consider again the regression of Average Attendance on Wins for the baseball teams examined in Exercise 44.a) What is the correlation between Wins and Average Attendance?b) What would you predict about the Average Attendance for a team that is 2 standard deviations above
Another cigarette Consider again the regression of Nicotine content on Tar (both in milligrams) for the cigarettes examined in Exercise 43.a) What is the correlation between Tar and Nicotine?b) What would you predict about the average Nicotine content of cigarettes that are 2 standard deviations
Attendance 2013, revisited In the previous chapter, you looked at the relationship between the number of wins by American League baseball teams and the average attendance at their home games for the 2013 season.Here are the scatterplot, the residuals plot, and part of the regression analysis:a) Do
Cigarettes Is the nicotine content of a cigarette related to the “tar”? A collection of data (in milligrams) on 29 cigarettes produced the scatterplot, residuals plot, and regression analysis shown:a) Do you think a linear model is appropriate here?Explain.b) Explain the meaning of R2 in this
Last ride Consider the roller coasters (with the outlier removed) described in Exercise 30 again. The regression analysis gives the model Duration = 85.83 + 0.397 Drop.a) Explain what the slope of the line says about how long a roller coaster ride may last and the height of the coaster.b) A new
More real estate Consider the Albuquerque home sales from Exercise 29 again. The regression analysis gives the model Price = 47.82 + 0.061 Size.a) Explain what the slope of the line says about housing prices and house size.b) What price would you predict for a 3000-square-foot house in this
SI jinx Players in any sport who are having great seasons, turning in performances that are much better than anyone might have anticipated, often are pictured on the cover of Sports Illustrated. Frequently, their performances then falter somewhat, leading some athletes to believe in a “Sports
ESP People who claim to “have ESP” participate in a screening test in which they have to guess which of several images someone is thinking of. You and a friend both took the test.You scored 2 standard deviations above the mean, and your friend scored 1 standard deviation below the mean. The
Another ride The regression of Duration of a roller coaster ride on the height of its initial Drop, described in Exercise 30, had R2 = 32.0%.a) What is the correlation between Drop and Duration?b) What would you predict about the Duration of the ride on a coaster whose initial Drop was 1 standard
Real estate redux The regression of Price on Size of homes in Albuquerque had R2 = 71.4,, as described in Exercise 29.a) What is the correlation between Size and Price?b) What would you predict about the Price of a home 1 SD above average in Size?c) What would you predict about the Price of a home
More misinterpretations A Sociology student investigated the association between a country’s Literacy Rate and Life Expectancy, and then drew the conclusions listed below. Explain why each statement is incorrect. (Assume that all the calculations were done properly.)a) The R2 of 64% means that
Misinterpretations A Biology student who created a regression model to use a bird’s Height when perched for predicting its Wingspan made these two statements.Assuming the calculations were done correctly, explain what is wrong with each interpretation.a) My R2 of 93% shows that this linear model
Coasters 2014 again Exercise 30 examined the association between the Duration of a roller coaster ride and the height of its initial Drop, reporting that R2 = 32.0,.Write a sentence (in context, of course) summarizing what the R2 says about this regression.
Real estate again The regression of Price on Size of homes in Albuquerque had R2 = 71.4,, as described in Exercise 29. Write a sentence (in context, of course)summarizing what the R2 says about this regression.
What slope again? If you create a regression model for estimating the business school GPA of a student (on a scale of 1–5) based on the Student’s Math Score on a standardized test (on a scale from 200–800), is the slope most likely to be closer to 0.01, 1, or 10? Explain.
What slope? If you create a regression model for predicting the Weight of a car (in pounds) from its Length (in feet), is the slope most likely to be 3, 30, 300, or 3000? Explain.
Coasters 2014, revisited The data set on roller coasters from Chapter 6, Exercise 23 lists the Duration of the ride in seconds in addition to the Drop height in feet. One coaster (the “Tower of Terror”) is unusual for having large drop but a short ride. After setting it aside, a regression to
Real estate A random sample of records of home sales from Feb. 15 to Apr. 30, 1993, from the files maintained by the Albuquerque Board of Realtors gives the Price and Size (in square feet) of 117 homes. A regression to predict Price (in thousands of dollars) from Size has an R2 of 71.4%. The
Residuals Tell what each of the residual plots below indicates about the appropriateness of the linear model that was fit to the data. b)
Residuals Tell what each of the residual plots below indicates about the appropriateness of the linear model that was fit to the data. b)
More regression equations Fill in the missing information in the following table. Sx y Sy r = bo + bx a) 30 4 18 6 -0.2 b) 100 10 18 60 10 0.9 c) d) 0.8 50 15 18 4 = -10 + 15x -0.6 30- 2x =
Regression equations Fill in the missing information in the following table. X Sx y Sy r = b + bx a) 29 1.2 23 4.3 0.8 b) 8 2.3 7 2.2 -0.7 c) 50 5 -0.7 = 51 - 7x d) 40.7 3.6 36.2 = -136 + 6x
Last tank! For Exercise 16’s regression model predicting fuel economy (in mpg) from the car’s engine size, se = 3.265. Explain in this context what that means.
Last bowl! For Exercise 15’s regression model predicting potassium content (in milligrams) from the amount of fiber (in grams) in breakfast cereals, se = 30.77. Explain in this context what that means.
Another car The correlation between a car’s engine size and its fuel economy (in mpg) is r = -0.8476. What fraction of the variability in fuel economy is accounted for by the engine size?
Cereal again The correlation between a cereal’s fiber and potassium contents is r = 0.903. What fraction of the variability in potassium is accounted for by the amount of fiber that servings contain?
More engine size In Exercise 16, the regression model mpg = 36.25 - 3.867 Engine Size relates cars’ engine size to their fuel economy (in mpg). Explain what the slope means.
Another bowl In Exercise 15, the regression model Potassium = 38 + 27 Fiber relates fiber (in grams) and potassium content (in milligrams) in servings of breakfast cereals. Explain what the slope means.
Engine size again Exercise 16 describes a regression model that uses a car’s engine size to estimate its fuel economy. In this context, what does it mean to say that a certain car has a positive residual?
More cereal Exercise 15 describes a regression model that estimates a cereal’s potassium content from the amount of fiber it contains. In this context, what does it mean to say that a cereal has a negative residual?
Engine size In Chapter 6, Exercise 41 we examined the relationship between the fuel economy (mpg) and Engine Size for 35 models of cars (Data in Fuel Economy 2014). Further analysis produces the regression model mpg = 36.25 - 3.867 Engine size. If the car you are thinking of buying has a 4 liter
Cereals For many people, breakfast cereal is an important source of fiber in their diets. Cereals also contain potassium, a mineral shown to be associated with maintaining a healthy blood pressure. An analysis of the amount of fiber (in grams) and the potassium content (in milligrams) in servings
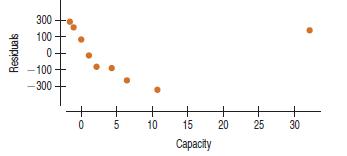
Disk drives 2014, residuals again Here is a scatterplot of the residuals from the regression of the hard drive prices on their sizes from Exercise 6.a) Are any assumptions or conditions violated? If so, which ones?b) What would you recommend about this regression? Residuals 300 100 0 -100 -300 0 5
Residual plots Here are residual plots (residuals plotted against predicted values) for three linear regression models. Indicate which condition appears to be violated(linearity, outlier or equal spread) in each case. a) Residual 15 10 5+ 0 -5 -10+ + + -10 0 b) Residual 50 40 30+ 20+ 10 0 -10+ + 10
Disk drives encore For the hard drive data of Exercise 6, find and interpret the value of R2
Bookstore sales last time For the regression model for the bookstore of exercise 5, what is the value of R2 and what does it mean?
Disk drives 2014, residuals Here are the residuals for a regression of Price on Capacity for the hard drives of Exercise 6. (based on the hand-computed coefficients.)a) Which residual contributes the most to the sum that is minimized by the Least Squares criterion?b) Five of the residuals are
Bookstore sales once more Here are the residuals for a regression of Sales on Number of Sales People Working for the bookstore of exercise 5:a) What are the units of the residuals?b) Which residual contributes the most to the sum that was minimized according to the Least Squares Criterion to find
Sophomore slump again? An online investment blogger advises investing in mutual funds that have performed badly the past year because “regression to the mean tells us that they will do well next year.” Is he correct?
Sophomore slump? A CEO complains that the winners of his “rookie junior executive of the year” award often turn out to have less impressive performance the following year. He wonders whether the award actually encourages them to slack off. Can you offer a better explanation?
Disk drives 2014 again Recall the data on disk drives we saw in chapter 6 exercise 4. Suppose we want to predict Price from Capacity.a) Find the slope estimate, b1.b) What does it mean, in this context?c) Find the intercept, b0.d) What does it mean, in this context? Is it meaningful?e) Write down
Bookstore sales revisited Recall the data we saw in Chapter 6, exercise 3 for a bookstore. The manager wants to predict Sales from Number of Sales People Working.a) Find the slope estimate, b1.b) What does it mean, in this context?c) Find the intercept, b0.d) What does it mean, in this context? Is
Residual interpretations The newborn grandson of one of the authors was 48 cm long and weighed 3 kg. According to the regression model of Exercise 3, what was his residual?What does that say about him?
Least squares interpretations A least squares regression line was calculated to relate the length (cm)of newborn boys to their weight in kg. The line is weight = -5.94 + 0.1875 length. Explain in words what this model means. Should new parents (who tend to worry) be concerned if their newborn’s
True or false II If false, explain briefly.a) Some of the residuals from a least squares linear model will be positive and some will be negative.b) Least Squares means that some of the squares of the residuals are minimized.c) We write yn to denote the predicted values and y to denote the observed
True or false If false, explain briefly.a) We choose the linear model that passes through the most data points on the scatterplot.b) The residuals are the observed y-values minus the y-values predicted by the linear model.c) Least squares means that the square of the largest residual is as small as
RECAP: Our regression model predicting hurricane wind speeds from the central pressure was reasonably successful. The negative slope indicates that, in general, storms with lower central pressures have stronger winds.Question: Can we conclude that lower central barometric pressure causes the higher
If you plan to hit the fast-food joints for lunch, you should have a good breakfast.Nutritionists, concerned about “empty calories” in breakfast cereals, recorded facts about 77 cereals, including their Calories per serving and Sugar content (in grams).(Data in Cereals)Question: How are
During the evening rush hour of August 1, 2007, an eight-lane steel truss bridge spanning the Mississippi River in Minneapolis, Minnesota, collapsed without warning, sending cars plummeting into the river, killing 13 and injuring 145. Although similar events had brought attention to our aging
The barometric pressure at the center of a hurricane is often used to measure the strength of the hurricane because it can predict the maximum wind speed of the storm. A scatterplot shows that the relationship is straight, strong, and negative. It has a correlation of -0.896. (Data in Hurricanes
Flights 2012 Here are the number of domestic flights flown in each year from 2000 to 2012 (www.TranStats.bts.gov/Data_Elements.aspx?Data=2).a) Find the correlation of Flights with Year.b) Make a scatterplot and describe the trend.c) Why is the correlation you found in part a not a suitable summary
Planets (more or less) On August 24, 2006, the International Astronomical Union voted that Pluto is not a planet. Some members of the public have been reluctant to accept that decision. Let’s look at some of the data. Is there any pattern to the locations of the planets? The table shows the
Vehicle weights The Minnesota Department of Transportation hoped that they could measure the weights of big trucks without actually stopping the vehicles by using a newly developed “weight-in-motion” scale. To see if the new device was accurate, they conducted acalibration test. They weighed
Thrills III For the roller coaster data in Exercise 47:a) Explain why in looking for a variable that explains rank, you will be hoping for a negative correlation.b) Do any of the provided variables provide a strong predictor for roller coaster rank?c) What other (unaccounted) for variables might
Thrills II For the roller coaster data in Exercise 47:a) Examine the relationship between Initial Drop and Speed.b) Examine the relationship between Initial Drop and Height.c) What conclusions can you safely draw about the initial drop of a roller coaster? Is Initial Drop strongly correlated with
Thrills Since 1994, the Best Roller Coaster Poll (www.ushsho.com/bestrollercoasterpoll.htm) has been ranking the world’s best roller coasters. In 2011, Bizarro earned the top steel coaster rank for the sixth straight year. Here are data on the top 10 steel coasters from this poll: Max Vert
Second inning 2013 Perhaps fans are just more interested in teams that win. The displays below are based on American League teams for the 2013 season. (espn.go.com) (Use the data set Attendance_2013).a) Do winning teams generally enjoy greater attendance at their home games? Describe the
Attendance 2013 American League baseball games are played under the designated hitter rule, meaning that pitchers, often weak hitters, do not come to bat. Baseball owners believe that the designated hitter rule means more runs scored, which in turn means higher attendance. Is there evidence that
Burgers II In the previous exercise you analyzed the association between the amounts of fat and sodium in fast food hamburgers. What about fat and calories?Here are data for the same burgers:a) Analyze the association between fat content and calories using correlation and scatterplots.b) Repeat
Burgers Fast food is often considered unhealthy because much of it is high in both fat and sodium. But are the two related? Here are the fat and sodium contents of several brands of burgers.a) Analyze the association between fat content and sodium using correlation and scatterplots.b) Find
Drug abuse A survey was conducted in the United States and 10 countries of Western Europe to determine the percentage of teenagers who had used marijuana and other drugs. The results are summarized in the following table.a) Create a scatterplot.b) What is the correlation between the percent of
Fuel economy 2014 Here are advertised engine size(in liters) and gas mileage (estimated combined city and highway) for several 2014 vehicles. (www.kbb.com)a) Make a scatterplot for these data.b) Describe the direction, form, and strength of the plot.c) Find the correlation between engine size and
Interest rates and mortgages 2013 Since 1985, average mortgage interest rates have fluctuated from a low of nearly 3% to a high of over 14%. Is there a relationship between the amount of money people borrow and the interest rate that’s offered? Here is a scatterplot of Mortgage Loan Amount in the
Income and housing The Office of Federal Housing Enterprise Oversight (www.fhfa.gov) collects data on various aspects of housing costs around the United States. Here is a scatterplot of the Housing Cost Index versus the Median Family Income for each of the 50 states. The correlation is 0.65.a)
Sample survey A polling organization is checking its database to see if the two data sources it used sampled the same ZIP codes. The variable Datasource = 1 if the data source is MetroMedia, 2 if the data source is DataQwest, and 3 if it’s RollingPoll. The organization finds that the correlation
Baldness and heart disease Medical researchers followed 1435 middle-aged men for a period of 5 years, measuring the amount of Baldness present (none = 1, little = 2, some = 3, much = 4, extreme = 5) and presence of Heart Disease (No = 0, Yes = 1). They found a correlation of 0.089 between the two
Correlation conclusions II The correlation between Fuel Efficiency (as measured by miles per gallon) and Price of 150 cars at a large dealership is r = -0.34.Explain whether or not each of these possible conclusions is justified:a) The more you pay, the lower the fuel efficiency of your car will
Correlation conclusions I The correlation between Height and Weight as measured on 90 people is r = 0.80.Explain whether or not each of these possible conclusions is justified:a) When Height increases, Weight increases as well.b) The form of the relationship between Height and Weight is straight.c)
Smart phones and life expectancy A survey of the world’s nations in 2014 shows a strong positive correlation between percentage of the country using smart phones and life expectancy in years at birth.a) Does this mean that smart phones are good for your health?b) What might explain the strong
Height and reading A researcher studies high schools and finds a strong positive linear association between funding and graduation rates.a) Does this mean that wealthier schools have a generally higher percentage of graduates?b) What might explain the strong correlation?
More correlation errors Students in the Economics class discussed in Exercise 31 also wrote these conclusions.Explain the mistakes they made.a) “There was a very strong correlation of 1.22 between Life Expectancy and GDP.”b) “The correlation between Literacy Rate and GDP was 0.83. This shows
Correlation errors Your Economics instructor assigns your class to investigate factors associated with the gross domestic product (GDP) of nations. Each student examines a different factor (such as Life Expectancy, Literacy Rate, etc.) for a few countries and reports to the class. Apparently, some
More predictions Hurricane Katrina’s hurricane force winds extended 120 miles from its center. Katrina was a big storm, and that affects how we think about the prediction errors. Suppose we add 120 miles to each error to get an idea of how far from the predicted track we might still find damaging
Prediction units The errors in predicting hurricane tracks (examined in this chapter) were given in nautical miles. A statutory mile is 0.86898 nautical mile. Most people living on the Gulf Coast of the United States would prefer to know the prediction errors in statutory miles rather than nautical
Association V A researcher investigating the association between two variables collected some data and was surprised when he calculated the correlation. He had expected to find a fairly strong association, yet the correlation was near 0. Discouraged, he didn’t bother making a scatterplot. Explain
Cold nights Is there an association between time of year and the nighttime temperature in North Dakota?A researcher assigned the numbers 1–365 to the days January 1–December 31 and recorded the temperature at 2:00 a.m. for each. What might you expect the correlation between DayNumber and
Traffic headaches A study of traffic delays in 68 U.S.cities found the following relationship between Total Delays(in total hours lost) and Mean Highway Speed:Is it appropriate to summarize the strength of association with a correlation? Explain. Total Delay (hr) 600,000- 450,000- 300,000 150,000-
Streams and hard water In a study of streams in the Adirondack Mountains, the following relationship was found between the water’s pH and its hardness (measured in grains):Is it appropriate to summarize the strength of association with a correlation? Explain. 8.0 7.6 7.2 + 6.8 6.4 125 250 375
Antidepressants A study compared the effectiveness of several antidepressants by examining the experiments in which they had passed the FDA requirements. Each of those experiments compared the active drug with a placebo, an inert pill given to some of the subjects.In each experiment some patients
Roller coasters 2014 Most roller coasters get their speed by dropping down a steep initial incline, so it makes sense that the height of that drop might be related to the speed of the coaster. Here’s a scatterplot of top Speed and largest Drop for 107 roller coasters around the world.a) Does the
Car thefts The National Insurance Crime Bureau reports that Honda Accords, Honda Civics, and Toyota Camrys are the cars most frequently reported stolen, while Ford Tauruses, Pontiac Vibes, and Buick LeSabres are stolen least often. Is it reasonable to say that there’s a correlation between the
Politics A candidate for office claims that “there is a correlation between television watching and crime.”Criticize this statement on statistical grounds.
Matching II Here are several scatterplots. The calculated correlations are -0.977, -0.021, 0.736, and 0.951.Which is which? (a) + + (p)
Matching Here are several scatterplots. The calculated correlations are -0.923, -0.487, 0.006, and 0.777.Which is which? (p) (5) (a) t + (a) +
Coffee sales Owners of a new coffee shop tracked sales for the first 20 days and displayed the data in a scatterplot(by day).a) Make a histogram of the daily sales since the shop has been in business.b) State one fact that is obvious from the scatterplot, but not from the histogram.c) State one
Firing pottery A ceramics factory can fire eight large batches of pottery a day. Sometimes a few of the pieces break in the process. In order to understand the problem better, the factory records the number of broken pieces in each batch for 3 days and then creates the scatterplot shown.a) Make a
Showing 3200 - 3300
of 5937
First
26
27
28
29
30
31
32
33
34
35
36
37
38
39
40
Last
Step by Step Answers