New Semester
Started
Get
50% OFF
Study Help!
--h --m --s
Claim Now
Question Answers
Textbooks
Find textbooks, questions and answers
Oops, something went wrong!
Change your search query and then try again
S
Books
FREE
Study Help
Expert Questions
Accounting
General Management
Mathematics
Finance
Organizational Behaviour
Law
Physics
Operating System
Management Leadership
Sociology
Programming
Marketing
Database
Computer Network
Economics
Textbooks Solutions
Accounting
Managerial Accounting
Management Leadership
Cost Accounting
Statistics
Business Law
Corporate Finance
Finance
Economics
Auditing
Tutors
Online Tutors
Find a Tutor
Hire a Tutor
Become a Tutor
AI Tutor
AI Study Planner
NEW
Sell Books
Search
Search
Sign In
Register
study help
business
intro stats
Intro Stats 5th Edition Richard D De Veaux, Paul F Velleman, David E Bock, Nick Horton - Solutions
Load the Kentucky Derby 2016 data into your preferred statistics package and answer the following questions;a) What was the name of the winning horse in 1880?b) When did the length of the race change?c) What was the winning time in 1974?d) Only one horse has run the Derby in less than 2 minutes.
Load the Indy 500 2016 data into your preferred statistics package and answer the following questions:a) What was the average speed of the winner in 1920?b) How many times did Bill Vukovich win the race in the 1950s?c) How many races took place during the 1940s?
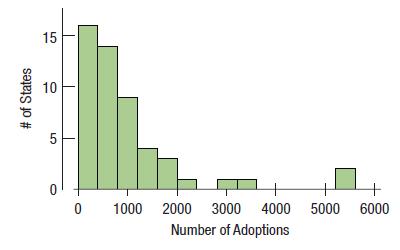
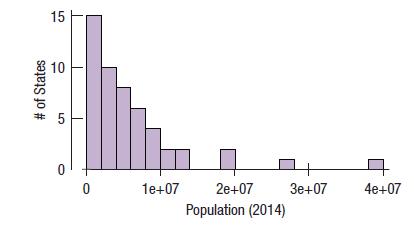
The U.S. Census Bureau keeps track of the number of adoptions in each state (and Washington, DC). (www.census .gov) The upper histogram shows the distribution of adoptions.The lower histogram shows the population of each state (and DC).a) What do the histograms say about the distributions? b)
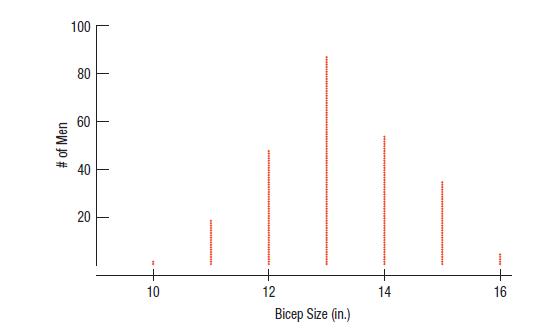
The study in Exercise 9 actually measured the bicep circumference in centimeters. The dot plot in Exercise 9 was formed by dividing each measurement by 2.54 to convert it to inches. Here is the dot plot of the original values in cm. Do the two dot plots look different? What might account for
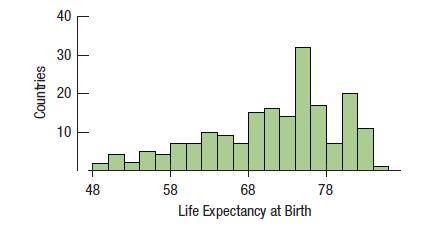
Here are the life expectancies at birth in 190 countries (2014) as collected by the World Health Organization.a) Describe the shape.b) How many modes do you see? Countries 40 30 20 10 48 58 68 Life Expectancy at Birth 78
Describe the shape of the distribution of bicep circumferences (in inches) for the 250 men in the study of Exercise 10.Data From Exercise 10The study in Exercise 9 actually measured the bicep circumference in centimeters. The dot plot in Exercise 9 was formed by dividing each measurement by 2.54 to
For the 146 life expectancies in Exercise 15,a) Which would you expect to be larger: the median or the mean? Explain briefly.b) Which would you report: the mean or the median? Explain briefly.Data From Exercise 15Here are the life expectancies at birth in 190 countries (2014) as collected by the
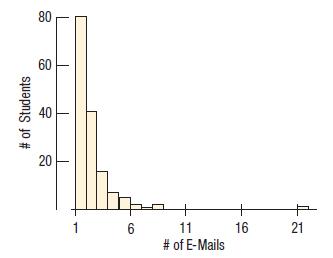
For the distribution of e-mails sent by students in Exercise 11, describe the shape.Data From Exercise 11A university teacher saved every e-mail received from students in a large introductory statistics class during an entire term. He then counted, for each student who had sent him at least one
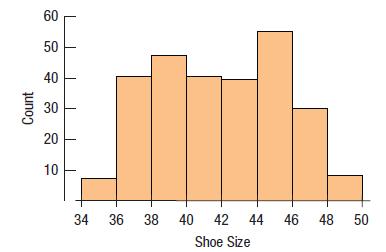
A last is a form, traditionally made of wood, in the shape of the human foot. Lasts of various sizes are used by shoemakers to make shoes. In the United States, shoe sizes are defined differently for men and women:U.S. men’s shoe size = (last size in inches x 3) – 24U.S. women’s shoe size =
For the number of adoptions in Exercise 12,a) Which would you expect to be larger: the median or the mean? Explain briefly.b) Which would you report: the mean or the median? Explain briefly.Data From Exercise 12The U.S. Census Bureau keeps track of the number of adoptions in each state (and
For the shoe sizes in Exercise 16, what might be the problem with either the mean or the median as a measure of center?Data From Exercise 16A last is a form, traditionally made of wood, in the shape of the human foot. Lasts of various sizes are used by shoemakers to make shoes. In the United
For the 190 life expectancies in Exercise 15, a) Would you report the standard deviation or the IQR?b) Justify your answer briefly.Data From Exercise 15Here are the life expectancies at birth in 190 countries (2014) as collected by the World Health Organization.
For the number of adoptions in Exercise 12,a) Would you report the standard deviation or the IQR?b) Justify your answer briefly.Data From Exercise 12The U.S. Census Bureau keeps track of the number of adoptions in each state (and Washington, DC). (www.census .gov) The upper histogram shows the
For the bicep measurements in Exercise 10, would you report the mean, the median, or both? Explain briefly.Data From Exercise 10The study in Exercise 9 actually measured the bicep circumference in centimeters. The dot plot in Exercise 9 was formed by dividing each measurement by 2.54 to convert it
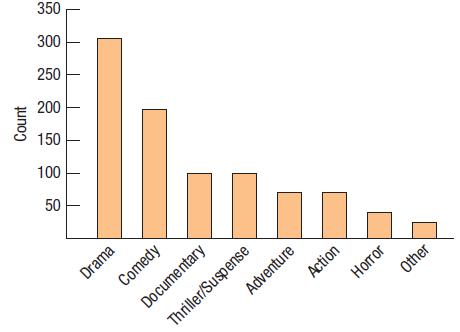
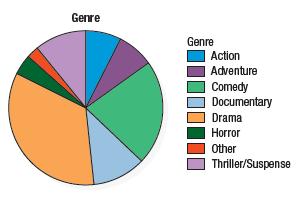
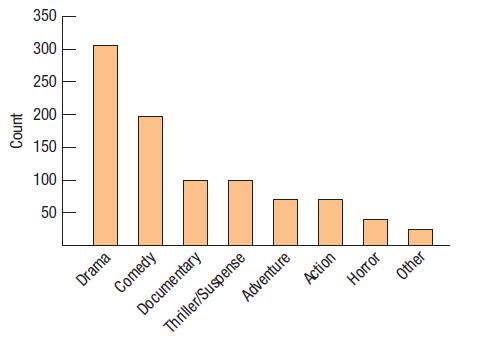
Here is a bar chart summarizing the movie genres from the 891 movies in Exercise 3.a) Were Thriller/Suspense or Adventure films more common?b) Is it easier to answer the question from the bar chart or from the pie chart in Exercise 3?Data From Exercise 3The pie chart summarizes the genres of the
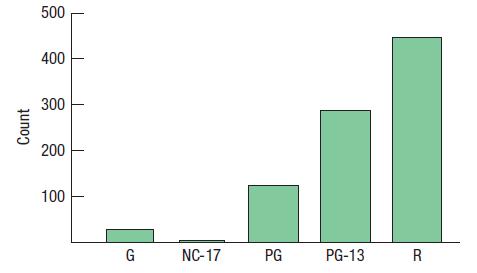
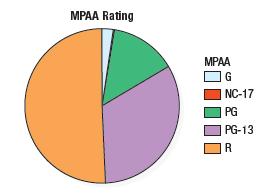
Here is a bar chart summarizing the movie ratings from the 891 movies shown in Exercise 4.a) Which was the least common rating?b) Is it easier to answer the question from the bar chart from the pie chart in Exercise 4?Data From Exercise 4The Motion Picture Association of America (MPAA) rates each
For the bicep measurements in Exercise 10, would you report the standard deviation or the IQR? Explain briefly.Data From Exercise 10The study in Exercise 9 actually measured the bicep circumference in centimeters. The dot plot in Exercise 9 was formed by dividing each measurement by 2.54 to convert
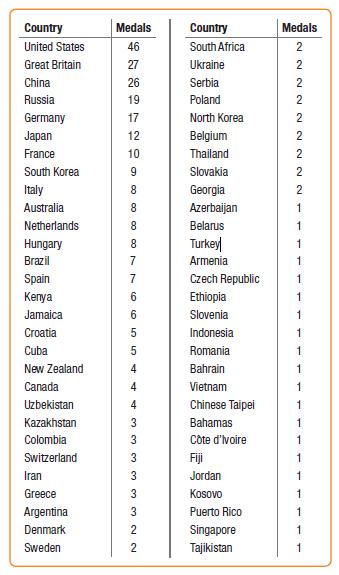
Fifty-nine countries won gold medals in the 2016 Summer Olympics. The table lists them, along with the total number of gold medals each won.a) Try to make a display of these data. What problems do you encounter?b) Organize the data so that the graph is more successful. Country United States Great
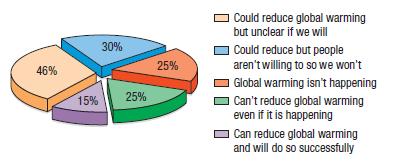
The Yale Program on Climate Change Communication surveyed 1263 American adults in March 2015 and asked them about their attitudes on global climate change. Here’s a display of the percentages of respondents choosing each of the major alternatives offered. List the errors in this display.
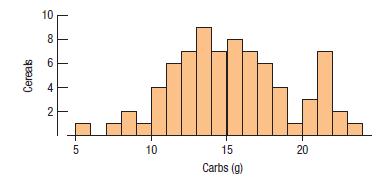
The histogram shows the carbohydrate content of 77 breakfast cereals (in grams).a) Describe this distribution.b) If you can, open the data set and identify the cereals with the highest carbohydrate content. Cereals 10 8 6 4 2 5 сл 10 15 Carbs (g) 20
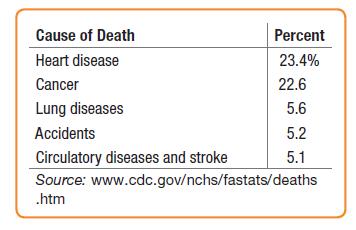
The Centers for Disease Control and Prevention lists causes of death in the United States during 2014:a) Is it reasonable to conclude that heart or lung diseases were the cause of approximately 29.04% of U.S. deaths in 2014?b) What percentage of deaths were from causes not listed here?c) Create an
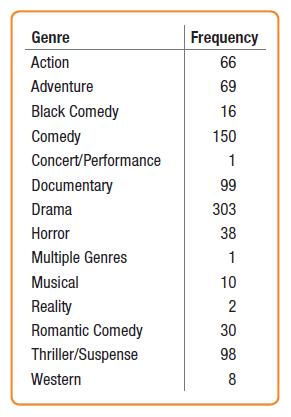
The movie genres listed in Exercise 35 were originally listed as these:a) What problem would you encounter in trying to make a display of these data?b) How did the creators of the bar chart in Exercise 35 solve this problem?Data From Exercise 35Here is a bar chart summarizing the movie genres from
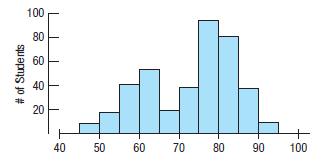
Test scores from a large calculus class of 400 are shown in the histogram below.a) Describe the distribution of scores. What might account for this shape?b) Why might both the mean and median score be misleading as a summary of the center? # of Students 100 80 60 40 20 40 50 60 70 80 90 100
An article in the Winter 2003 issue of Chance magazine (www.chance.amstat.org) reported on the Houston Independent School District’s magnet schools programs. Of the 1755 qualified applicants, 931 were accepted, 298 were waitlisted, and 526 were turned away for lack of space. Find the relative
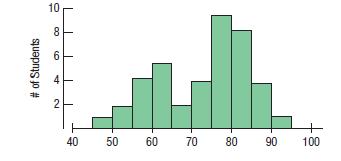
Test scores from a calculus section of 40 students are shown in the histogram below.Describe the distribution of scores. Why might you be less sure of the description of the shape as compared to the histogram in Exercise 51?Data From Exercise 51Test scores from a large calculus class of 400 are
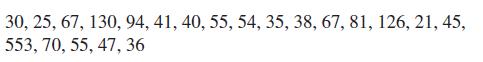
Using the data from Exercise 56, write up a short report describing the distribution of the number of deaths in the United States from tornadoes during this time period.Data From Exercise 56Here are the annual numbers of deaths from tornadoes in the United States from 1995 through 2015: 30, 25, 67,
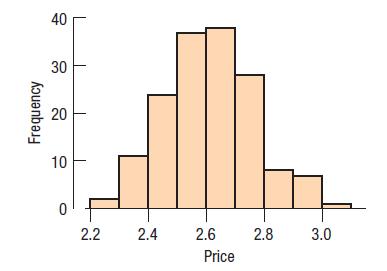
The histogram shows the distribution of the prices of plain pizza slices (in $) for 156 weeks in Dallas, TX.Which summary statistics would you choose to summarize the center and spread in these data? Why? Frequency 40 30 20 10 0 2.2 2.4 2.6 Price 2.8 3.0
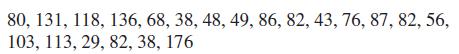
Here are the annual numbers of deaths from floods in the United States from 1995 through 2015:Find these statistics:a) Meanb) Median and quartilesc) Range and IQR 80, 131, 118, 136, 68, 38, 48, 49, 86, 82, 43, 76, 87, 82, 56, 103, 113, 29, 82, 38, 176
Here are the annual numbers of deaths from tornadoes in the United States from 1995 through 2015:Find these statistics:a) Meanb) Median and quartilesc) Range and IQR 30, 25, 67, 130, 94, 41, 40, 55, 54, 35, 38, 67, 81, 126, 21, 45, 553, 70, 55, 47, 36
Using the data from Exercise 55, write a short report describing the distribution of the number of deaths in the United States from floods during this time period.Data From Exercise 55Here are the annual numbers of deaths from floods in the United States from 1995 through 2015: 80, 131, 118, 136,
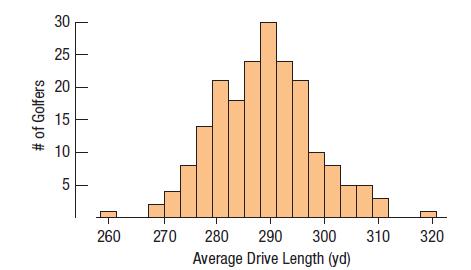
The display shows the average drive distance (in yards) for 199 professional golfers during a week on the men’s PGA tour in 2015.a) Describe this distribution.b) Approximately what proportion of professional male golfers drive, on average, 280 yards or less?c) Estimate the mean by examining the
Exercise 64 looked at distances PGA golfers can hit the ball. The standard deviation of these average drive distances is 11.2 yards, and the quartiles are Q1 = 282.05 yards and Q3 = 294.5 yards.a) Write a sentence or two describing the spread in distances based oni. The quartiles.ii. The standard
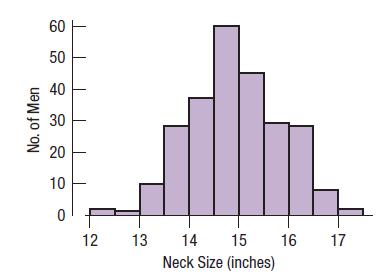
The histogram shows the neck sizes (in inches) of the 250 men recruited for the health study in Utah from Exercise 9.Which summary statistics would you choose to summarize the center and spread in these data? Why?Data From Exercise 9A study of body fat on 250 men collected measurements of 12 body
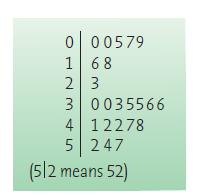
Alex Rodriguez (known to fans as A-Rod) was the youngest player ever to hit 500 home runs. Here is a stem-and leaf display of the number of home runs hit by A-Rod during the 1994–2016 seasons. Describe the distribution, mentioning its shape and any unusual features. 0 00579 1 68 2 3 3 0035566 4
Look again at the histogram of men’s neck sizes in Exercise 60.a) Is the mean closer to 14, 15, or 16 inches? Why?b) Is the standard deviation closer to 1 inch, 3 inches, or 5 inches? Explain.Data From Exercise 60The histogram shows the neck sizes (in inches) of the 250 men recruited for the
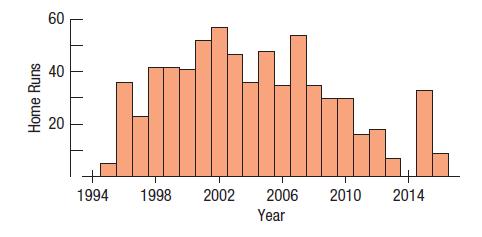
Students were asked to make a histogram of the number of home runs Alex Rodriguez hit from 1994 to 2016 (see Exercise 73). One student submitted the following display:a) Comment on this graph.b) Create your own histogram of the data. Home Runs 60 40 20 T I 1 T 1994 1998 2002 2006 Year 2010 2014
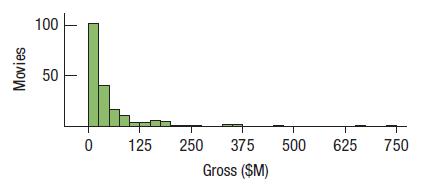
The histogram shows total gross earnings (in millions of dollars) of the top 200 major release movies in 2015.An industry publication reports that the typical movie makes $23.2 million, but a watchdog group concerned with rising ticket prices says that the average earnings are closer to $55.7
Showing 5900 - 6000
of 5937
First
46
47
48
49
50
51
52
53
54
55
56
57
58
59
60
Step by Step Answers