New Semester
Started
Get
50% OFF
Study Help!
--h --m --s
Claim Now
Question Answers
Textbooks
Find textbooks, questions and answers
Oops, something went wrong!
Change your search query and then try again
S
Books
FREE
Study Help
Expert Questions
Accounting
General Management
Mathematics
Finance
Organizational Behaviour
Law
Physics
Operating System
Management Leadership
Sociology
Programming
Marketing
Database
Computer Network
Economics
Textbooks Solutions
Accounting
Managerial Accounting
Management Leadership
Cost Accounting
Statistics
Business Law
Corporate Finance
Finance
Economics
Auditing
Tutors
Online Tutors
Find a Tutor
Hire a Tutor
Become a Tutor
AI Tutor
AI Study Planner
NEW
Sell Books
Search
Search
Sign In
Register
study help
business
macroeconomics principles
Macroeconomics 11th Edition Andrew B Abel - Solutions
This question asks you to study whether unanticipated declines in the money stock tend to raise interest rates and lead to recessions, as implied by the misperceptions theory.a. Using quarterly data from 1960 to the present, define unanticipated money growth in each quarter to be the rate of M2
Are people's inflation forecasts rational? To investigate this question, go to the website of the Federal Reserve Bank of Philadelphia at www.philadelphiafed.org. Find the webpages for Research and Data and look for data from the Survey of Professional Forecasters on forecasts of CPI inflation.
The University of Michigan has conducted an extensive survey of consumers since 1978, including a question on consumers' forecasts of inflation. Gather data on inflation expectations from the Michigan survey using FRED. First, plot those forecasts along with forecasts from the Survey of
Define efficiency wage. What assumption about worker behavior underlies the efficiency wage theory? Why does it predict that the real wage will remain rigid even if there is an excess supply of labor?
How does the full-employment level of employment, \(\bar{N}\), defined in the Keynesian model differ from that defined in the classical model? How might a productivity shock affect \(\bar{N}\) for the classical model but not for the Keynesian model?
How do the assumptions of prices in the Keynesian and classical models have different implications on monetary policy?
Describe three alternative responses available to policymakers when the economy is in recession. What are the advantages and disadvantages of each strategy? Be sure to discuss the effects on employment, the price level, and the composition of output. What are some of the practical difficulties in
Why does the classical model perform better than the Keynesian model in explaining the business cycle fact of procyclical labor productivity? How can the concept of labor hoarding help Keynesians improve their model's prediction?
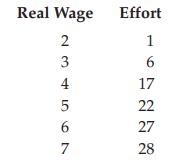
A firm identifies the following relationship between the real wage it pays and the effort made by workers:The marginal product of labor for this firm is\[M P N=\frac{E(60-N)}{27},\]where \(E\) is the effort level and \(N\) is the number of workers employed. If the firm can pay only one of the wage
Consider the following Keynesian closed economy:Consumption \(\quad C=388+0.4(Y-T)-600 r\).Investment \(I=352-400 r\).Government purchases \(G=280\).Taxes \(\quad T=300\).Full-employment output \(\bar{Y}=1400\).Money supply \(\quad M=12,600\).Real money demand \(\quad L=1750+0.75 Y\)\[
An economy is described by the following equations:Desired consumption \(C^{d}=300+0.5(Y-T)-300 r\).Desired investment \(\quad I^{d}=100-100 r\).Government purchases \(\quad G=100\).Taxes \(T=100\).Real money demand \(\quad L=0.5 Y-200 r\).Money supply \(\quad M=6300\).Full-employment output
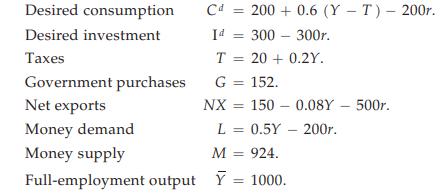
Consider the following economy.Desired consumption \(\quad C^{d}=325+0.5(Y-T)\) \(-500 r\).Desired investment \(I^{d}=200-500 r\).Government purchases \(\quad G=150\).Taxes \(T=150\).Real money demand \(L=0.5 Y-1000 r\).Money supply \(M=6000\).Full-employment output \(\bar{Y}=1000\).Note that the
Examine the effect of each of the following on output, the real interest rate, employment, and the price level in the short run and the long run. Use the Keynesian IS-LM graph to explain your answer.a. A government builds more public housing, and construction firms invest more in machinery to speed
Examine the effect of each of the following on output, the real interest rate, employment, and the price level in the short run and the long run. Use the Keynesian IS-LM graph to explain your answer.a. After a financial crisis, people lose confidence in the financial market and prefer to hold more
Suppose that the Fed has a policy of increasing the money supply when it observes that the economy is in recession. However, suppose that about six months are needed for an increase in the money supply to affect aggregate demand, which is about the same amount of time needed for firms to review and
Keynesian theory predicts that expansionary fiscal policy-either higher spending or lower taxes-will raise the real interest rate. Using data since 1960, graph the Federal government budget deficit, the state-local government budget deficit (both relative to GDP), and the real interest rate
Because of price stickiness, the Keynesian model predicts that an increase in the growth rate of money will lead to higher inflation only after some lag, when firms begin to adjust their prices. Using data since 1960, graph the inflation rate and the rate of growth of M2. Prior to 1980, is it true
The theory of macroeconomic stabilization policy in this chapter provides a playbook for monetary policy. When the economy is weak, the Federal Reserve eases monetary policy by increasing the money supply and reducing the real interest rate. When the economy is strong and inflation is rising, the
What is the Phillips curve? Does the Phillips curve relationship hold for U.S. data? Explain.
In a particular economy, recent labor statistics show that unemployment has fallen. Its economic advisor explains that economic expansion and falling inflation may persist if oil prices continue to fall. Can you justify her argument in terms of the Phillips curve?
Can policymakers exploit the Phillips curve relationship by trading more inflation for less unemployment in the short run? In the long run? Explain both the classical and Keynesian points of view.
Two changes are observed in a labor market: firms are quicker to hire and fire workers, and the mismatch across industrial sectors increases. Will these raise the natural unemployment rate? If yes, what government policies would you suggest to lower it?
How does the sacrifice ratio measure the costs of disinflation? Use the expectations-augmented Phillips curve to explain how expectations can reduce the costs of disinflation.
Why does the Federal Reserve work hard to establish its credibility? What benefits might the public gain if the Federal Reserve has a great deal of credibility?
Suppose that the government provides more job training programs and job search services so as to help workers improve productivity and find jobs.a. What will be the effect on the natural unemployment rate? How does this affect the expectationsaugmented Phillips curve and the long-run Phillips
Using annual data since 1956, create scatter plots of the following variables:a. CPI inflation rate (December to December) against the average unemployment rate for the year.b. CPI inflation rate against the cyclical unemployment rate. (The cyclical unemployment rate is the actual unemployment rate
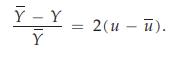
In this exercise, you are going to examine the historical data on Okun's Law, which we used in our discussion of the costs of unemployment. The level form of Okun's Law in Eq. (3.5) states that the output gap, \(\frac{\bar{Y}-Y}{\bar{Y}}\), equals cyclical unemployment, \(u-\bar{u}\), multiplied by
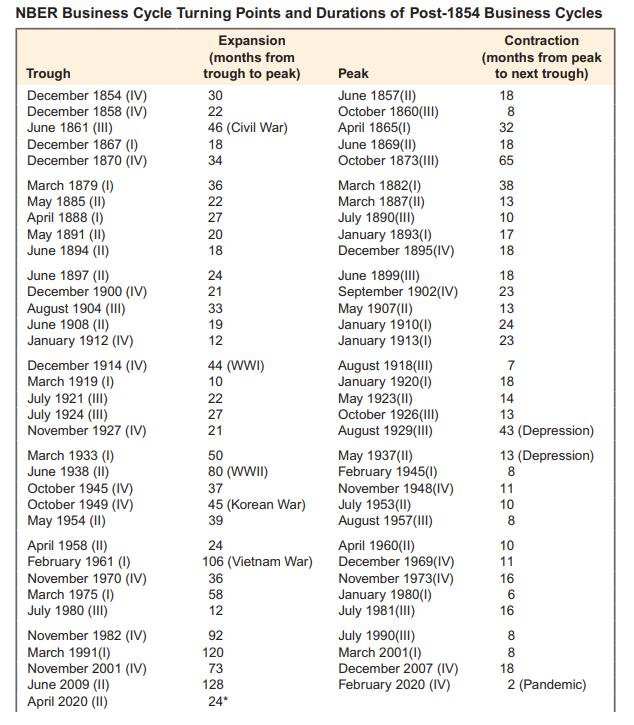
For each month since January 1960, calculate the share of total unemployment accounted for by people unemployed for 15 weeks or more. How is this ratio related to the business cycle (for peak and trough dates, see Table 8.1), and to the overall unemployment rate? What are the implications of these
Download data from FRED on inflation expectations from the University of Michigan survey of consumers. In Excel, plot the change in the expected inflation rate from 12 months earlier. In which periods did expected inflation decline by more than one percentage point over the 12 months? In which
What is the J curve? What explains the behavior of net exports represented by the J curve?
Why is the real exchange rate important in macroeconomic analysis? How does it affect net exports? Explain and give an example.
After seven years of decreasing and steadily low interest rates, the Federal Reserve Bank decided in December 2015 to make a policy change and increase the Federal Fund Rate. Assuming that all other factors are held constant, which effects would this change in real interest rates have had on the
What are the factors that influence the open economy IS curve? How did China benefit from opening its economy?
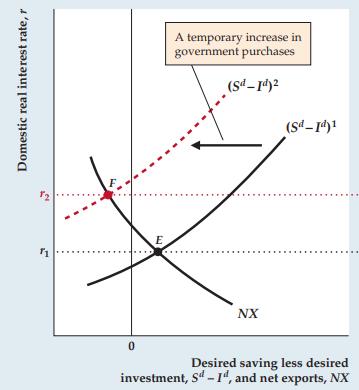
How are net exports affected by expansionary fiscal policy? By expansionary monetary policy? What is the potential ambiguity in determining these effects?
Find a country that has fixed its exchange rate to a foreign currency. Describe its advantages and disadvantages for the economy.
Discuss the relative advantages and disadvantages of flexible exchange rates, fixed exchange rates, and a currency union.
Japan produces and exports only cameras, and Saudi Arabia produces and exports only barrels of oil. Initially, Japan exports 40 cameras to Saudi Arabia and imports 64 barrels of oil. The real exchange rate is 4 barrels of oil per camera. Neither country has any other trading partners.a. Initially,
Consider the following Keynesian economy:a. What are the general equilibrium (that is, long-run) values of output, the real interest rate, consumption, investment, net exports, and the price level?b. Starting from full employment, government purchases are increased by 62 , to 214 . What are the
Consider the following classical economy:\[\begin{array}{ll}A D & Y=400+50 \mathrm{M} / \mathrm{P} \\A S & Y=\bar{Y}=1000 .\end{array}\]This economy produces only wine, its output is measured in terms of wine, and its currency is francs. It trades with a country that produces only cheese, and the
a. For the economy described in Numerical Problem 4, find the values of all the parameters of Eqs. (13.B.1), (13.B.2), and (13.B.3). Use Eqs. (13.B.8) and (13.B.9) to derive the open-economy IS curve for this economy.b. Derive the \(L M\) curve for this economy.c. Find output, the real interest
Recessions often lead to calls for protectionist measures to preserve domestic jobs. Suppose that a country that is in a recession imposes restrictions that sharply reduce the amount of goods imported by the country.a. Using the Keynesian IS-LM model, analyze the effects of import restrictions on
After the financial crisis reached Europe in 2008, a lot of EU citizens sold their euro investments and converted the money into Swiss francs or gold. Why did they do this? What impact did this have on the exchange rates of the euro and Swiss franc and the price of gold? Use the classical IS-LM
The Greek government-debt crisis started in late 2009 and forced the European Union and the European Central Bank (ECB) to adapt their policies in order to save Greece from bankruptcy.a. What was the effect of the problems in Greece and other struggling eurozone countries on the exchange rate of
Use a diagram like that in Fig. 13.7a to analyze the effect on a country's net exports of a beneficial supply shock that temporarily raises full-employment output by 100 per person. Assume that the basic classical model applies so that income is always at its full employment level.a. Suppose that,
Consider the theoretical impact of a trade war, with increased tariffs imposed by all major countries in the world. Suppose that the trade war's main effect is to reduce the benefits of comparative advantage, so that countries no longer specialize in goods as much as before and that therefore the
The Bretton Woods fixed-exchange-rate system was terminated in 1972, and the main currencies of the world now follow a flexible exchange rate system governed by market forces.a. Graph the eurozone's nominal exchange rate and real effective exchange rates from 1994 to the present. What are your
Using quarterly data since 1994, graph Japan's real exchange rate against its net exports as a fraction of GDP. Also create a scatterplot of these two variables and add a trend line for each. Is the theoretically predicted relationship of the real exchange rate and net exports visible in the
Plot the exchange rate of the Hong Kong dollar relative to the U.S. dollar from January 1981 to the present. Was the Hong Kong dollar generally appreciating or depreciating relative to the U.S. dollar between 1981 and late 1983? What happened after 1983? Research and find an explanation for the
Plot data on the exchange rate between the dollar and the euro, along with the FRED series for the trade weighted broad exchange rate for the United States. How do the patterns of the two exchange rates differ? Consider plotting the inverse of the exchange rate between the dollar and euro to see
If you were a member of the NBER business-cycle dating committee, would you declare that the U.S. economy is now in a recession? Why? Describe the major variables that you would look at to determine whether the economy is in a recession or not, and what features of the data you would look for.
When a recession occurs, do economists expect it to be temporary? Or is there some degree of permanence? What is the empirical evidence for this?
What are the two components of a theory of business cycles?
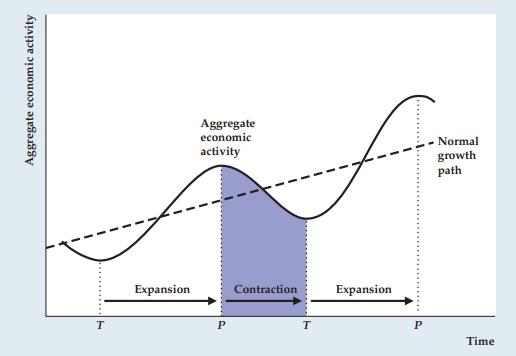
Figure 8.1 shows that business cycle peaks and troughs are identified with peaks and troughs in the level of aggregate economic activity, which is consistent with current NBER methodology. However, for business cycles before 1927, the NBER identified business cycle peaks and troughs with peaks and
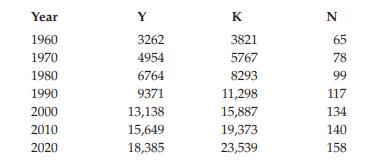
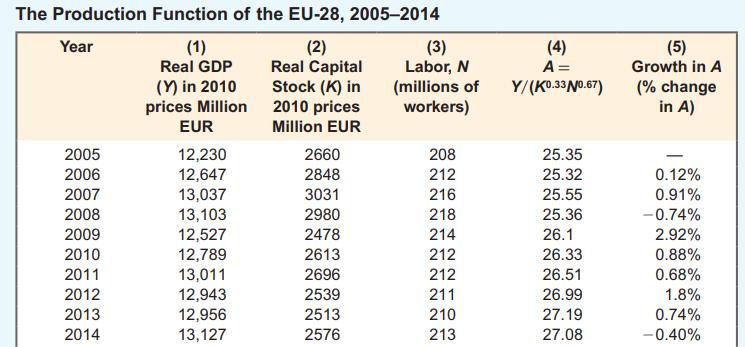
The following data give real GDP, Y, capital, \(K\), and labor, \(N\), for the U.S. economy in various years.Units and sources are the same as in Table 3.1. Assume that the production function is \(Y=A K^{0.3} N^{0.7}\).a. By what percentage did U.S. total factor productivity grow in each decade?b.
Suppose the production function is \(Y=A K^{0.3} N^{0.7}\) and that in 2000, \(K=1000, N=100\), and \(Y=199.5\). In 2010, capital, labor, and output have doubled, so \(K=2000\), \(N=200\), and \(Y=399\).a. By what percentage did productivity grow from 2000 to 2010 ?b. If output had risen to 798
Suppose the economy's production function is \(Y=\) \(A K^{0.3} N^{0.7}\) and that \(K=200, N=2000\), and \(A=1\). Calculate the marginal products of labor and capital.
Self-employed workers in the United States must pay Social Security taxes equal to \(12.4 \%\) of any income up to \(\$ 147,000\) in 2022 . This income level of \(\$ 147,000\) is known as the "cap." Income in excess of the cap is not subject to Social Security tax, so self-employed workers with
Calculate and graph the growth rate of total factor productivity since 1960 using FRED series MFPNFBS. This series is not the same as used in Table 3.1, but is similar. How would you characterize the movements in productivity since 1960? How do recessions affect the growth rate of productivity? How
Using monthly seasonally adjusted data from 1960 to the present, calculate and graph the total workingage population (called the civilian noninstitutional population), the number of employed workers, the number of unemployed workers, and the number of workers in the labor force.At the website of
Plot a graph of quarterly data for real GDP and fullemployment GDP from 1970 to the present. (In the FRED database, full-employment GDP is called Real Potential GDP.) Which variable is "smoother"? How would you characterize the volatility of real GDP before 1980 compared with after 1980? From 1950
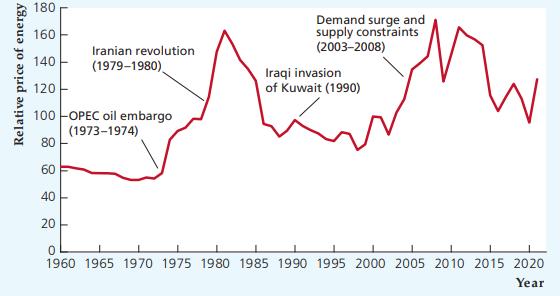
Figure 3.11 shows the relative price of energy. In this exercise, we derive the series plotted in that figure and examine recent data. First, find data on the producer price index for fuels and related products and power, and plot the growth rate in the index from one year earlier. What is the
Define the expected real after-tax interest rate. If the tax rate on interest income declines, what happens to the expected real after-tax interest rate?
Huxley, the owner of the Missing Link Chain-Link Fence Company is trying to determine how many chain-link fabricating machines to buy for its factory. If we define a chain-link fence of some specified length to be equal to one unit of output, the price of a new fabricating machine is 60 units of
A consumer has initial real wealth of 20 , current real income of 90 , and future real income of 110 . The real interest rate is \(10 \%\) per period.a. Find the consumer's PVLR.b. Write the equation for the consumer's budget constraint (using the given numerical values) and graph the budget line.
(Appendix 4.A) A consumer lives three periods, called the learning period, the working period, and the retirement period. Her income is 200 during the learning period, 800 during the working period, and 200 again during the retirement period. The consumer's initial assets are 300 . The real
Draw a budget line and indifference curves for a consumer who initially is a borrower. Be sure to indicate the no-borrowing, no-lending point and the optimal consumption point. Then show the effect on the budget line and the consumer's optimal consumption of an increase in the real interest rate.
Consumers typically pay a higher real interest rate to borrow than they receive when they lend (by making bank deposits, for example). Draw a consumer's budget line under the assumption that the real interest rate earned on funds lent, \(r_{1}\) is lower than the real interest rate paid to borrow,
Graph the index of consumer sentiment, using quarterly data since 1965. Construct scatter plots relating the consumer sentiment index to the growth rate of real consumption expenditures, using quarterly data since 1965. Generally speaking, does consumption grow more quickly when consumers are more
The Wilshire 5000 stock market index measures the total dollar value of a large set of stocks traded on the stock market. The real value of the Wilshire 5000 index, which measures the real value of the wealth represented by that set of stocks, is obtained by dividing the index by a measure of the
This problem asks you to calculate the actual (as opposed to the expected) real after-tax interest rate using annual data from 1961 to the present. The formula for the actual real after-tax interest rate is \((1-t) i-\pi\), where \(i\) is the nominal interest rate, \(t\) is the tax rate, and
Using quarterly data from 1947 to the present, graph residential fixed investment relative to GDP.a. Compare the graph of residential fixed investment relative to GDP to a graph of the civilian unemployment rate. What happens to residential investment during recessions? In this respect, is
The chapter claims that interest rates tend to move together. Using monthly data since 1975, graph the interest rate on three-month Treasury bills, the yield on high-grade corporate bonds, the 30 -year conventional mortgage rate, the prime rate charged by banks, and the yield on ten-year Treasury
Graph real private nonresidential fixed investment in(a) structures,(b) equipment, (c) intellectual property products since 1999 . How has the relative emphasis on the three types of investment changed? Can you think of an explanation?
A U.S. publisher sells $200 worth of books to a resident of Brazil. By itself, this item increases the U.S. current account balance. Describe some offsetting transactions that could ensure that the U.S.current account and financial account balances would continue to sum to zero.
Generally, what types of changes in desired saving and desired investment lead to large current account deficits in a small open economy? What factors lead to these changes in desired saving and desired investment?
In what periods has the United States had twin deficits? In what periods did the deficits move in opposite directions?
A popular measure of a country's "openness" to international trade is an index computed as the sum of the country's exports and imports divided by its GDP. Calculate and graph the openness index for the United States using quarterly data since 1947. What has been the postwar trend? Can you think of
Using quarterly data since 1960, graph output and absorption (both in real terms) in the same figure. In another figure, graph real investment, national saving, and the current account balance for the same period. (Use real GNP, which includes net factor payments, as the measure of output and/or
Using quarterly data since 1960, graph the following four series, expressing each as a percent of GDP: exports of goods (sometimes called merchandise), exports of services, imports of goods (sometimes called merchandise), and imports of services. What trends do you notice in U.S. exports and
In FRED, find and plot data on the ratio of outstanding total international debt to GDP for(a) the Euro area,(b) the United States,(c) Japan. These amounts represent the international indebtedness of each region to the rest of the world. Which region has the highest international debt relative to
How did technology increase U.S. economic growth in the 1990s?
Explain what is meant by a steady state. In the Solow model, which variables are constant in a steady state?
What types of government policies can increase long-run living standards?
Describe the main ideas of endogenous growth theory. What does it say about the role of government in economic growth?
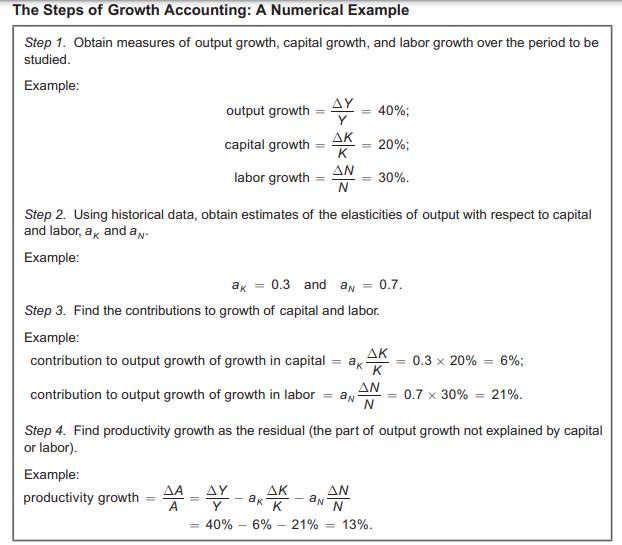
This problem asks you to do your own growth accounting exercise. Using data since 1960, make a table of annual growth rates of real GDP, the capital stock, and civilian employment. Assuming \(a_{K}=0.3\) and \(a_{N}=0.7\), find the productivity growth rate for each year.a. Graph the contributions
Graph the U.S. capital-labor ratio since 1960 (use private fixed assets from the Fixed Assets section of the BEA website, www.bea.gov, Table 6.2 as the measure of capital, and civilian employment as the measure of labor). Do you see evidence of convergence to a steady state during the postwar
According to the Solow model, if countries differed primarily in terms of their capital-labor ratios, with rich countries having high capital-labor ratios and poor countries having low capital-labor ratios, then countries that have a lower real GDP per capita income should grow faster than
In FRED, get data on the levels of real GDP per capita for both the United States and China for the most recent year that such data are available for both countries. By what percentage does real GDP per capita in the United States exceed real GDP per capita in China? Next, calculate and report the
Describe what is meant by the expectations theory of the term structure of interest rates. Why isn’t the expectations theory sufficient to describe the data on interest rates that we observe? What must be added to the expectations theory to form a more accurate theory?
What are the major components of M1? What are the major components of M2? Describe each component.
Suppose the interest rate on a one-year bond today is \(6 \%\) per year, the interest rate on a one-year bond one year from now is expected to be \(4 \%\) per year, and the interest rate on a one-year bond two years from now is expected to be \(3 \%\) per year. The term premium on a two-year bond
Jason has wealth of \(\$ 100,000\) that he invests entirely in money (a checking account) and government bonds. Jason instructs his broker to invest \(\$ 50,000\) in bonds, plus \(\$ 5000\) more in bonds for every percentage point that the interest rate on bonds exceeds the interest rate on his
What happens to M1 and M2 due to each of the following changes?a. You take \(\$ 500\) out of your checking account and put it into a passbook savings account.b. You take \(\$ 1000\) out of your checking account and buy traveler's checks.c. You take \(\$ 1500\) out of your money-market mutual fund
Graph the CPI inflation rate, M1 money growth, and M2 money growth for the United States, using annual data since 1959. Find annual growth rates for December to December.) Also graph the three-year average rate of inflation and the three-year averages of M1 growth and M2 growth, starting with 1962.
Graph the three-month Treasury bill interest rate, the ten-year government bond interest rate, and the CPI inflation rate (based on the percentage change in the CPI from one year earlier) on the same figure, using data since 1961. Make sure that the units are comparable.a. In general, how are
Find and plot data since 1960 on the net worth as a percentage of disposable personal income of households and nonprofit organizations. In which periods was net wealth as a percentage of income generally rising? In what periods was it falling? By what percentage did it decline during the Great
How have total output and output per worker changed over time in the United States? How have these changes affected the lives of typical people?
Define inflation and deflation. Compare the behavior of consumer prices in the United States in the years before and after World War II.
Define trade deficit and trade surplus. In recent years, has the U.S. economy had trade deficits or trade surpluses? What was the U.S. experience from 1900 to 1970?
What was stagflation, and when did it occur? How did it change economists’ views about macroeconomics?
Showing 4600 - 4700
of 6280
First
40
41
42
43
44
45
46
47
48
49
50
51
52
53
54
Last
Step by Step Answers