New Semester
Started
Get
50% OFF
Study Help!
--h --m --s
Claim Now
Question Answers
Textbooks
Find textbooks, questions and answers
Oops, something went wrong!
Change your search query and then try again
S
Books
FREE
Study Help
Expert Questions
Accounting
General Management
Mathematics
Finance
Organizational Behaviour
Law
Physics
Operating System
Management Leadership
Sociology
Programming
Marketing
Database
Computer Network
Economics
Textbooks Solutions
Accounting
Managerial Accounting
Management Leadership
Cost Accounting
Statistics
Business Law
Corporate Finance
Finance
Economics
Auditing
Tutors
Online Tutors
Find a Tutor
Hire a Tutor
Become a Tutor
AI Tutor
AI Study Planner
NEW
Sell Books
Search
Search
Sign In
Register
study help
business
macroeconomics principles
Macroeconomics Principles and Applications 6th edition Robert E. Hall, Marc Lieberman - Solutions
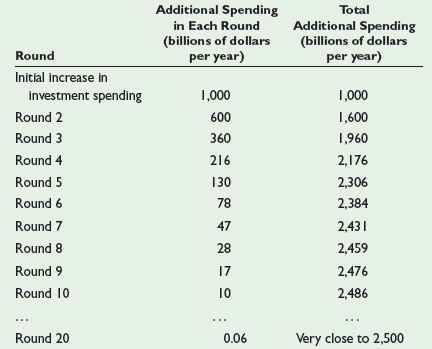
Assuming the MPC is 0.8, construct a table similar to the following table in this chapter.a. Show what would happen in the first five rounds following an increase in investment spending from $400 billion to $800 billion.b. If investment spending stays at $800 billion, what would be the ultimate
What would be the effect on real GDP and total employment of each of the following changes?a. As a result of restrictions on imports into the United States, net exports (NX) increase.b. The federal government launches a new program to improve highways, bridges, and airports.c. Banks are offering
Use an aggregate expenditure diagram to show the effect of each of the following changes:a. An increase in autonomous consumption spending due, say, to optimism on the part of consumersb. An increase in U.S. exportsc. An increase in U.S. importsIn each case, be sure to label the initial equilibrium
Draw a graph showing a 45° line and an aggregate expenditure line.a. Choose a point where real GDP is less than aggregate expenditure and label it GDPA. Explain what will happen to inventories if the economy is operating at this point. What signal does this send to firms? Is GDPA sustainable?b.
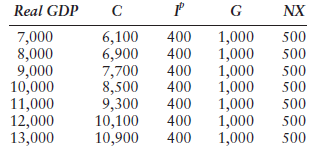
a. What is the marginal propensity to consume implicit in these data?b. What is the numerical value of the expenditure multiplier for this economy?c. What is the equilibrium level of real GDP?d. Suppose that government purchases (G) decreased from 1,000 to 400 at each level of income. What would
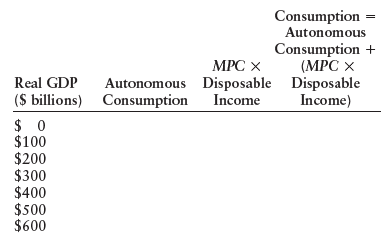
a. Complete the following table when autonomous consumption is $30 billion, the marginal propensity to consume is 0.85, and net taxes are $0.b. Use your answers in part (a) and assume planned investment is $40 billion, government spending is $20 billion, exports are $20 billion, and imports are $35
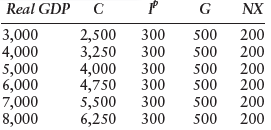
a. What is the marginal propensity to consume implicit in these data?b. Plot a 45° line, and then use the data to draw an aggregate expenditure line.c. What is the equilibrium level of real GDP? Illustrate it on your diagram.d. Suppose that investment spending increased by 250 at each level of
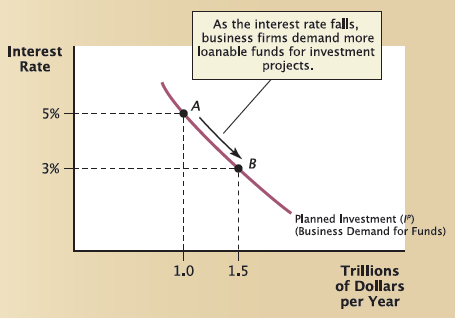
In the chapter, you learned that forces outside of the loanable funds market can influence the interest rate. Suppose the supply and demand curves in the loanable funds market are as depicted in Figure 7 of the previous chapter (Economic Growth and Rising Living Standards). Suppose that the saving
In Figure 5(b), we assumed that when saving rises, none of the additional saving enters the loanable funds market. Suppose, instead, that 40 percent of any additional saving is supplied to financial intermediaries, while the rest goes into safes and mattresses. Also assume that 30 cents out of
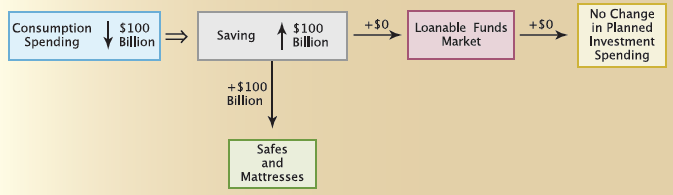
In Figure 5(b), we assumed that household saving rises by $100 billion per year, and none of this additional saving goes into the loanable funds market. Under this assumption, would total lending during the year be zero? Explain. No Change in Planned Investment Spending +$0 Loanable Funds Market
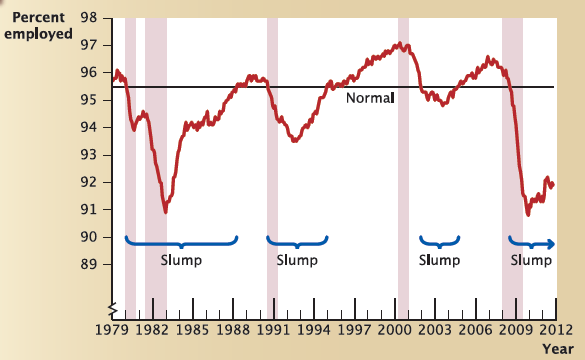
€œImmediately after a recession ends, the employment rate begins rising.€ Evaluate this statement, based on the historical record in the following figure. Percent 98 employed 97 96 Normal 95 94 93 92 91 90 - Slump Slump Slump Slump 89 1979 1982 1985 1988 1991 1994 1997 2000
“Every U.S. recession over the last 5 decades has been caused by an increase in oil prices.” True or false? Explain briefly.
during which the U.S. economy was clearly:a. In the midst of an expansion but not yet experiencing a boom.b. In the midst of an expansion and also in the midst of a boom.c. In the midst of an expansion and also in the midst of a slump.d. In the midst of a recession but not yet in a slump.
Economist Amartya Sen has argued that famines in underdeveloped countries are not simply the result of crop failures or natural disasters. Instead, he suggests that wars, especially civil wars, are linked to most famine episodes in recent history. Using a framework similar to Figure 10, discuss the
For each of the following scenarios, calculate the percentage change in real GDP per capita, assuming there is no change in technology:a. Average hours are constant; EPR, productivity, and population each increase by 2%.b. Average hours and EPR are constant; productivity increases by 2%.c. Average
On a diagram, draw an economy’s aggregate production function. On the same diagram, add curves to illustrate where the production function would be in five years under each of the following assumptions. (Label your additional curves a, b, and c, and assume nothing else affecting economic growth
Assume that average work hours, the employment– population ratio and technology all remain constant in a less developed country. The country initially has $100 billion in capital. For each of the following scenarios, describe what will happen over time to the country’s (1) production
Redraw Figure 10 from the chapter, adding the new PPF the country would face in Year 2 if it produces at point H in Year 1. Explain your drawing.
State whether each of the following statements is true or false, and explain your reasoning briefly. Assume in each case that the population remains constant. a. “A permanent increase in employment from a lower to a higher level will cause an increase in real GDP per capita, but not
Show what would happen to the production function if the capital stock decreased. Suppose, too, that the decrease in the capital stock because t made workers less productive to firms—shifted the labor demand curve leftward. Graphically illustrate the full impact of a decrease in the
In addition to shifting the production function upward, an increase in the capital stock will ordinarily make workers more productive and shift the labor demand curve rightward. Graphically illustrate the full impact of an increase in the nation’s capital stock under this assumption.
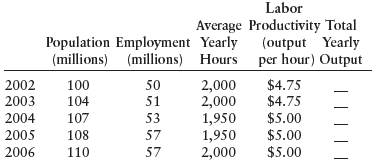
Below are hypothetical data for the country of Barrovia:a. Fill in the entries for total output in each of the five years.b. Calculate the following for each year (except 2002):(1) Population growth rate (from previous year)(2) Growth rate of output (from previous year)(3) Growth rate of per capita
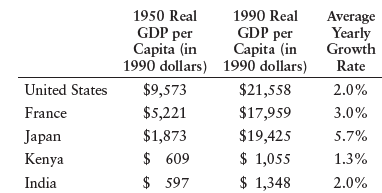
Below are past GDP and growth data for the United States and four other countries:a. For both years, calculate each country€™s per capita GDP as a percentage of U.S. per capita GDP. Which countries appeared to be catching up to the United States, and which were lagging behind?b. If all
[Requires appendix.] Suppose that Classica has international trade, but it is running a trade surplus (X > IM) rather than a trade deficit as in the appendix.Suppose, too, that Classica’s government is running a budget deficit.a. Draw a diagram for Classica’s loanable funds market, being
Suppose that the government budget is balanced (G = T), and household saving is $1 trillion.a. If this is a closed economy, what is the value of planned investment (Ip)?b. If this is an open economy with balanced trade (IM = X), will investment have the same value as you found in (a)? Briefly, why
The following figure shows the impact of a tax cut on the loanable funds market when the entire tax cut is spent. What if, instead, the entire tax cut had been saved?a. Draw a diagram of the loanable funds market showing the impact of a tax cut that is entirely saved. (Assume the government is
When the government runs a budget surplus (T > G), it deposits any unspent tax revenue into the banking system, thus adding to the supply of loanable funds. In this case, the supply of loanable funds is household saving plus the budget surplus [S + (T - G)], while the demand for funds is just
For the economy in problem 7, suppose that the government had purchased $2 billion more in goods and services than you found in that problem, with no change in taxes.a. Explain how each of the variables you calculated in problem 7 would be affected (i.e., state whether it would increase or
The following data give a complete picture of the household, business, and government sectors for 2011 in the small nation of Sylvania. (All dollar figures are in billions.)Consumption spending.............................................................. $ 50Capital stock (end of
As the baby boomers retire, spending on Social Security benefits is rising. Assume that (1) the government— which is already running a budget deficit—pays for the increased benefits with further borrowing; (2) the additional Social Security benefits are spent by households; (3) there are no
Return to problem 4. What will happen if consumption spending starts to rise? Assume no change in net taxes. Show the effect on the loanable funds market, and explain what will happen to C, Ip, and G. (Note: You won’t be able to find specific numbers.)
The following data ($ millions) are for the island nation of Pacifica over a year.Total output ................................................................... $10Total
Consider the following statement: “In the classical model, just as an increase in government purchases causes complete crowding out, so a decrease in government purchases causes complete crowding in.”a. In this statement, explain what is meant by “crowding in” and “complete crowding
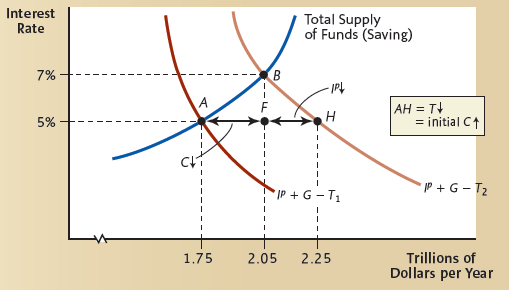
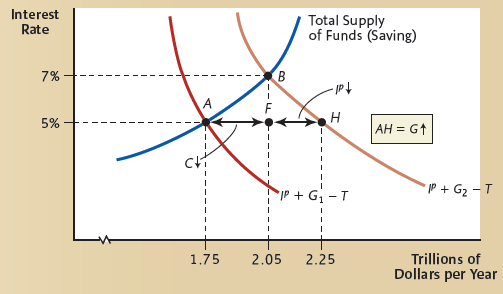
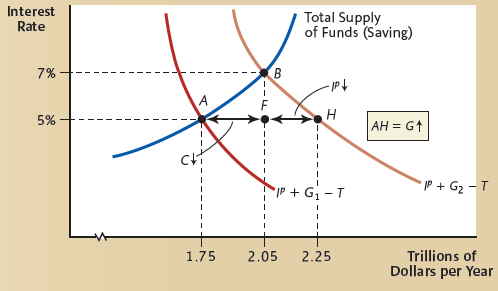
Draw a diagram (similar to the following figure in this chapter) illustrating the impact of a decrease in government purchases. Assume the government is running a budget deficit both before and after the change in government purchases. On your diagram, identify distances that represent:a. The
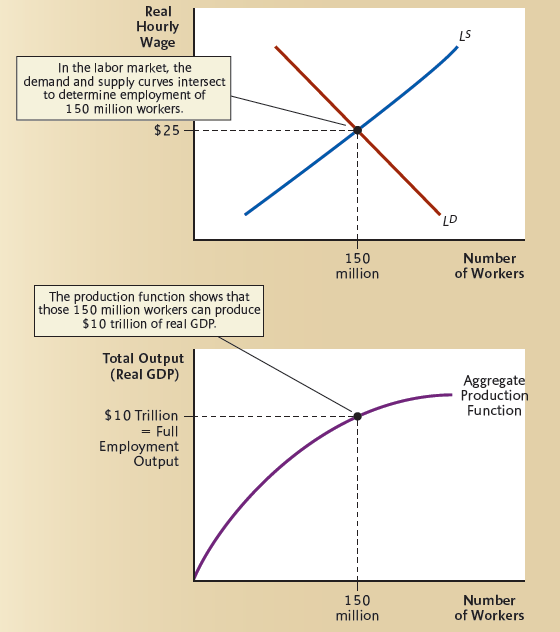
Use a diagram similar to the following figure to illustrate the effect, on aggregate output and the real hourly wage, of(a) an increase in labor demand and(b) an increase in labor supply. Real Hourly Wage LS In the labor market, the demand and supply curves intersect to determine employment of 150
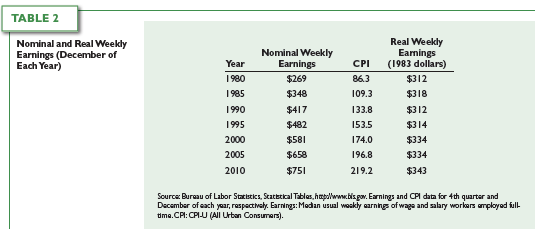
In Table 2, you can see that the CPI rose from 174.0 in December 2000 to 219.2 in December 2010. The average annual inflation rate from 2000 to 2010 was 2.34 percent. That is, 174.0 × (1.0234)10 = 219.2.Suppose that this average annual rate of inflation overstates the actual annual
Suppose we want to change the base period of the CPI from July 1983 to December 2000. Recalculate December’s CPI for each of the years in Table 1, so that the table gives the same information about inflation, but the CPI in December 2000 now has the value 100 instead of 174.0.
In December 2008, some economists forecast deflation for the coming year—a decrease in the price level, and therefore a negative inflation rate. Suppose a lender at that time expected deflation over the next twelve months of −1.0 percent, and loaned out funds for one year at a nominal annual
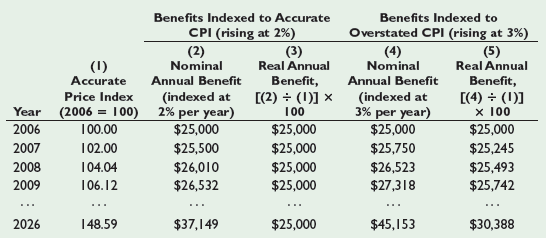
As in the following table, consider someone who retired in 2006 with $25,000 in initial Social Security benefits per year, and that the actual inflation rate is 2 percent per year over the next 20 years. But now, suppose that the CPI overstates inflation by 2 full percentage points each year.a.
During the late 19th and early 20th centuries, many U.S. farmers favored inflationary government policies. Why might this have been the case?
a. Jodie earned $25,000 at the end of year 1, when the CPI was 460. If the CPI at the end of year 2 is 504, what would Jodie have to earn at the end of year 2 to maintain a constant real wage?b. What would she have to earn in year 2 to obtain a 5 percent increase in her real wage? [Use the
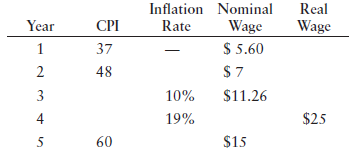
Complete the following table. (CPI numbers are for the end of each year.) Inflation Nominal Real CPI Year Rate Wage Wage $ 5.60 37 2 48 $11.26 10% $25 4 19% $15 60 3.
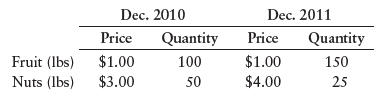
An economy has only two goods, whose prices and typical consumption quantities are as follows:a. Using December 2010 as the base period for calculations and also as the year for measuring the typical consumer€™s market basket, calculate the CPI in December 2010 and December 2011.b. What
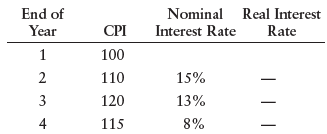
Given the following data, calculate the approximate real interest rate for years 2, 3, and 4. (Assume that each CPI number tells us the price level at the end of each year.)If you lent $200 to a friend at the beginning of year 2 at the prevailing nominal interest rate of 15 percent, and your friend
If there is 5 percent inflation each year for 8 years, what is the total amount of inflation (i.e., the total percentage rise in the price level) over the entire 8-year period?
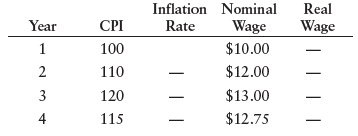
Given the following year-end data, calculate both the inflation rate and the real hourly wage rate for years 2, 3, and 4. Inflation Nominal Real CPI Year Rate Wage Wage $10.00 100 2 $12.00 110 3 120 $13.00 $12.75 4 115 |||
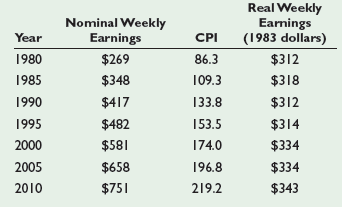
Calculate the total percentage change in real weekly earnings (excluding benefits) from 2000 to 2005 using the last column of Table 2. Compare your answer to the answer in problem 3. Which is the more accurate answer? TABLE 2 Real Weekly Earnings (1983 dollars) Nominal and Real Weekly Earnings
Use your answers from problems 2(a) and 2(b) to obtain the total percentage change in real weekly earnings (excluding benefits) from 2000 to 2005.
Using the data in the following table, calculate the following for the period 2000 2005:a. The total percentage change in the nominal weekly earningsb. The total percentage change in the price level Real Weekly Earnings (1983 dollars) Nominal Weekly Earnings Year CPI 1980 $269 86.3 $312 $348 1985
Calculate each of the following from the data in the following table in this chapter.a. The inflation rate for the year 2008b. Total inflation (the total percentage change in the price level) from December 1970 to December 2005Actual and Potential Output (GDP)................................ $10
After the attacks of September 11, 2001, U.S. businesses began to spend more on security, and they continue to do so today. For example, airlines and package delivery services run more background checks on their employees, and office buildings employ more security guards than they did before the
After the attacks of September 11, 2001, U.S. businesses began to spend more on security, and they continue to do so today. For example, airlines and package delivery services run more background checks on their employees, and office buildings employ more security guards than they did before the
Suppose, in a given year, someone buys a Ford automobile for $30,000. That same year, Ford produced the car in Michigan, using $10,000 in parts imported from Japan. However, the parts imported from Japan themselves contained $3,000 in components produced in the United States.a. By how much does
The Bureau of Economic Analysis (BEA) currently treats research and development (R&D) expenses as an intermediate good. That is, R&D expenses are assumed to be already included in other goods sold by firms that pay for the R&D. Beginning in 2013, however, the BEA will begin counting
The following table shows an estimate of the destruction caused by the terrorist attacks of September 11:Type of Property…………………………………. Estimated LossWorld Trade Center……………….………………. $ 6.7 billionComplex buildingsContents of buildings
Refer to question 8. The 2,140 Ziponians who searched for work during the previous four weeks included: 54 ski resort employees who lost their winter jobs but expect to get them back in late fall; 200 recent high school graduates; 258 former textile workers who lost their jobs when their employers
a. The country of Ziponia uses the same method to calculate the unemployment rate as the U.S. Bureau of Labor Statistics uses. From the data below, compute Ziponia’s unemployment rate.Under………………………………………........................…………. 16 9,000Over
Suppose that in one year household consumption falls by $20 billion (compared to the year before), but business firms continue to produce consumer goods at an unchanged rate. If there is no other change affecting real GDP that year, what will happen to total real GDP? What will happen to each of
Ginny asks, “If I buy a sweater that was produced in Malaysia, why is its purchase price subtracted from GDP?” How should you answer her question?
In December 2005, the BLS estimated there were 7.4 million unemployed, 142.8 million employed, 451,000 discouraged workers, and 4.8 million people (including discouraged workers) who were marginally attached to the labor force. What would the unemployment rate have been in December 2005 if it had
Toward the end of this chapter, it was stated that if half of the 8.8 million involuntary part-time workers in August 2011 were counted as unemployed, then the unemployment rate that month would have been 12.0 percent instead of 9.1 percent. Do the necessary calculations to confirm this statement,
The country of Freedonia uses the same method to calculate the unemployment rate as the U.S. Bureau of Labor Statistics uses. From the following data, compute Freedonia’s unemployment rate.Population................................................................................. 10,000,000Under
Calculate the total change in a year’s U.S. GDP for each of the following scenarios. (Assume that all production takes place in the U.S., unless otherwise stated.)a. A family sells a home, without using a broker, for $150,000. They could have rented it on the open market for $700 per month. They
Using the expenditure approach, which of the following would be directly counted as part of U.S. GDP?For those that count, state whether the action causes an increase in C, I, G, or NX. (If you need to make any special assumptions, state them.)a. A new personal computer produced by IBM, which
Assume that the country of Ziponia produced real GDP equal to $5,000 (in billions) in the year 2000.a. Calculate Ziponia’s output for each year from 2000 to 2006, assuming that it experienced a constant growth rate of 6 percent per year over this period. Use your answers to construct a graph
Use the information in the table below to calculate the percentage change in real GDP from 2007 to 2008, from 2008 to 2009, and from 2009 to 2010.Real............................................................. GDP Year (Billions of 2005
Suppose that real GDP had grown by 3 percent each year from 2004 to 2007. Using some of the data in problem 3:a. What would real GDP have been in 2007?b. Based on your answer in (a) above, what would output per person have been in 2007?
In 2004, real GDP (at 2005 prices) was $12,247 billion. In 2007, it was $13,206 billion. During the same period, the U.S. population rose from 292.9 million to 301.4 million.a. What was the total percentage increase in real GDP from 2004 to 2007?b. What was the total percentage increase in the U.S.
Over the past 90 years, the U.S., unlike some other countries, has not experienced ‘double digit’ inflation.” Is this statement true or false? Explain briefly.
“In 2010, in the aftermath of our most recent recession, the yearly average U.S. unemployment rate rose to its highest level in over 90 years.” Is this statement true or false? Explain briefly.
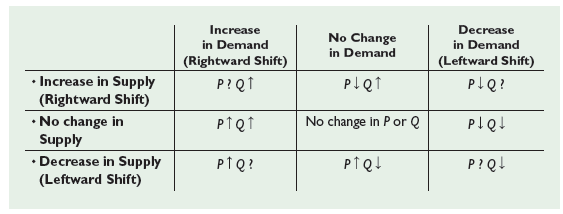
Every year, the housing market in Monotone, Arizona, has the same experience: The demand curve for housing shifts rightward by 500 homes, 500 new homes are built, and the price of the average home doesn’t change. Using supply and demand diagrams, illustrate how each of the following new events,
Suppose you buy a home for $200,000, making a $40,000 down payment and taking out a mortgage for the rest. The annual interest rate on your mortgage is 5%, which is also the interest rate you can earn when you invest your funds elsewhere. (Ignore any possible tax benefits from your mortgage, as
Suppose you buy a home for $200,000, using your own funds funds. The annual interest rate you could earn by investing your funds elsewhere is 5%. (Ignore any sales commissions or fees associated with buying or selling a home.)a. If the price at which you could sell the home remains at $200,000,
In a study session, one of your fellow students says, “I think our econ text book has a mistake: It shows the supply curve for housing as a vertical line, which implies that a rise in price causes no change in quantity supplied. But everyone knows that if home prices rise, construction firms will
In early 2011, even though cotton prices were high, cotton farmers in China began to hoard (rather than sell) most of the crop they had harvested, filling spare rooms and even living areas of their homes with cotton. Given the cost and inconvenience of storing large amounts of cotton rather than
The table at the end of this problem gives hypothetical data for the quantity of electric scooters demanded and supplied per month.a. Graph the demand and supply curves.b. Find the equilibrium price and quantity.c. Illustrate on your graph how an increase in the wage rate paid to scooter assemblers
How would each of the following affect the market for denim jeans in the United States? Illustrate each answer with a supply-and-demand diagram.a. The price of denim cloth increases.b. An economic slowdown in the United States causes household incomes to decrease.
Consider the following passage from an article in the New York Times on March 9, 2011, “In the last few years, coffee yields have plummeted here [Colombia] and in many of Latin America’s other premier coffee regions as a result of rising temperatures and more intense and unpredictable rains,
Evaluate the following statement: €œIf the dollar values in the following table are accurate, it follows that providing meningococcal vaccines to all adolescents would be cheaper than installing seat belts on all school buses.€ True or false? Explain. Decrease in Demand
Suppose that you are considering what to do on an upcoming weekend. Here are your options, from least to most preferred:(1) Study for upcoming midterms; (2) Fly to Colorado for a quick ski trip; (3) Go into seclusion in your dorm room and try to improve your score on a computer game.What
Showing 6200 - 6300
of 6280
First
49
50
51
52
53
54
55
56
57
58
59
60
61
62
63
Step by Step Answers