New Semester
Started
Get
50% OFF
Study Help!
--h --m --s
Claim Now
Question Answers
Textbooks
Find textbooks, questions and answers
Oops, something went wrong!
Change your search query and then try again
S
Books
FREE
Study Help
Expert Questions
Accounting
General Management
Mathematics
Finance
Organizational Behaviour
Law
Physics
Operating System
Management Leadership
Sociology
Programming
Marketing
Database
Computer Network
Economics
Textbooks Solutions
Accounting
Managerial Accounting
Management Leadership
Cost Accounting
Statistics
Business Law
Corporate Finance
Finance
Economics
Auditing
Tutors
Online Tutors
Find a Tutor
Hire a Tutor
Become a Tutor
AI Tutor
AI Study Planner
NEW
Sell Books
Search
Search
Sign In
Register
study help
business
microsoft excel data analysis 7th
Microsoft Excel Data Analysis And Business Modeling 7th Edition Wayne Winston - Solutions
Use a LAMBDA helper function to create an email list from the addresses in the Problem 11 Data worksheet. Remember that the email addresses need to be separated by a semicolon.
Use a LAMBDA helper function to compute the product of all numbers greater than or equal to 11 in the Problem 9 Data worksheet.Data from in problem 9Use a LAMBDA helper function to return for each number greater than or equal to 11 in the Problem 9 Data worksheet, the square of that number, and a
Use a LAMBDA helper function to return for each number greater than or equal to 11 in the Problem 9 Data worksheet, the square of that number, and a blank space otherwise.
Use a LAMBDA helper function to determine the smallest number in each column of the data in the Problem 7 Data worksheet.Data from in problem 7Use a LAMBDA helper function to determine the largest number in each row of the data in the Problem 7 Data worksheet.
Use a LAMBDA helper function to determine the largest number in each row of the data in the Problem 7 Data worksheet.
Use a LAMBDA helper function to compute the sum of the squares of all numbers in the Problem 5 Data worksheet.Data from in problem 5Use a LAMBDA helper function to determine whether each number in the data in the Problem 5 Data worksheet is greater than or equal to the average value of the data.
Use a LAMBDA helper function to determine whether each number in the data in the Problem 5 Data worksheet is greater than or equal to the average value of the data.
Cell G13 of the Problem 3 Data worksheet contains a formula to compute the distance between two locations on Earth, given their latitude and longitude. Create a LAMBDA function named MILES that enables you to enter the latitude and longitude of two locations and returns the distance between them.
The Problem 2 Data worksheet contains January–April sales data for eight salespeople. If their total sales are at least $110, their bonus is 40 percent of sales; if their total sales are from $100 to $109, their bonus is 20 percent of sales. Otherwise, their bonus is 5 percent of sales. Write a
For the PivotTable example in the Ptcustomers.xlsm file, create a macro that clears any filters on customers.
Modify your Problem 1 macro to enter the team members in a single row, starting in any cell you want.Data from in problem 1Your MBA team members are Wayne, Taylor, Britney, and Katy. Create a macro that enters the team members in cells A1:D1.
The Trendandseasonality.xlsx workbook contains five years of quarterly sales data for a company whose sales exhibit strong seasonality and a well-defined trend in sales. Choose the best result from Analyze Data that summarizes the data and create a chart that you feel is most relevant.
The Old Faithful.xlsx workbook contains for the Old Faithful geyser in Yellowstone National Park the duration (in seconds) of eruptions and the time (in minutes) since the last eruption. You are interested in determining how the time since the last eruption affects the duration of the next
The Teachers.xlsx workbook contains standardized test scores for students in 5th grade at Walt Whitman Elementary School. You are also given each student’s 5th grade teacher and their 4th grade test score. You are interested in determining how each 5th grade teacher’s students improved (or not)
In his best-selling book Blink, Malcolm Gladwell relates that hockey players born earlier in the year are more likely to make the National Hockey League than players born later in the year. Use the data in the Hockey.xlsx workbook to investigate this hypothesis. Choose the best result from Analyze
Each row of the EyeColor.xlsx workbook contains a person’s eye and hair color. You are interested in determining the relationship between eye and hair color. Choose the best result from Analyze Data and create a PivotTable and PivotChart that you feel are most relevant.
Each row of the Drug.xlsx workbook tells you for people with the same disease whether their condition improved and whether or not they were given a new drug. You want to know if the drug was effective. Choose the best result from Analyze Data and create a PivotTable and PivotChart that you feel are
Create bin ranges that are round numbers for the histogram created in the stock return example.
For each of your answers in Problem 1, determine the value consumers place on the 2,000th unit purchased of your game.Data from in problem 1Suppose you are charging $60 for a board game you invented, and you have sold 3,000 copies during the last year. The elasticity for board games is known to
Suppose you are charging $60 for a board game you invented, and you have sold 3,000 copies during the last year. The elasticity for board games is known to equal 3. Use this information to determine a linear and power demand curve.
On August 9, 2002, Microsoft stock was selling for $48.58 per share. A $35 European call option, expiring on January 17, 2003, was selling for $13.85. Use this information to estimate the implied volatility for Microsoft stock. Use a T-bill rate of 4 percent.
Going into the 2003 NBA finals, the rating system described in Chapter 72 rated the San Antonio Spurs three points higher than the New Jersey Nets. Teams play until one team wins four games. The first two games were at San Antonio, the next three at New Jersey, and the final two games were
You need to clean your house today. In the Problem 2 worksheet, you are given data about how long it has taken to clean your house in the past. If you start cleaning at noon, what are the chances that you’ll be finished in time to leave at 7:00 p.m. for a movie?
In the Problem 1 worksheet, you are given data about the duration of a machine’s lifetime. Answer the following questions:What is the probability that the machine will last at least 10 hours?What is the probability that the machine will last from 1 to 5 hours?What is the probability that the
In the Willy Loman problem, suppose you must visit New York immediately after Denver. What is the solution to the problem?
Suppose that you live in Atlanta and are driving 29 general managers home. Each time you visit an arena, you drop off a GM at his home arena. In what order should you drop off the GMs to minimize the total distance traveled by the GMs?
The file Nbamiles.xlsx is used in Problems 2 and 3. The file gives the distances between each pair of NBA arenas. Suppose you live in New York and want to visit each arena once and return to New York. In what order should you visit the cities to minimize the total distance traveled?
Students at the School of Fine Arts apply to study either English or science. You have been tasked to determine whether the School of Fine Arts discriminates against women in admitting students to the school of their choice. You are given the following data for the School of Fine Arts
You own a fast-food restaurant and have done some market research in an attempt to better understand your customers. For a random sample of customers, you are given the income, gender, and number of days per week that they go out for fast food. Use this information to determine how gender and
Contoso Ltd. produces microchips. Five types of defects (labeled 1–5) have been known to occur. The chips are manufactured by two operators (A and B) using four machines (1–4).You are given data about a sample of defective chips, including the type of defect, the operator, the machine number,
Set up data validation to ensure that a person can enter only dates that are on Monday through Friday.
Set up data validation to ensure that a column of numbers is entered in descending order.
The file named Candybardata.xlsx contains a list of stores where you sell candy bars. The worksheet also contains the types of candy bars you sell at each store and the price charged for each candy bar. Set up the worksheet so that users can enter or select both the store and a candy bar from a
You have been asked to evaluate the quality of care given to heart-attack patients at the Emergency Room (ER) and Chicago Hope (CH). For the last month, you are given the following patient data:Hospital (ER or CH)Risk category (high or low)Patient outcome (live or die)Keeping in mind that high-risk
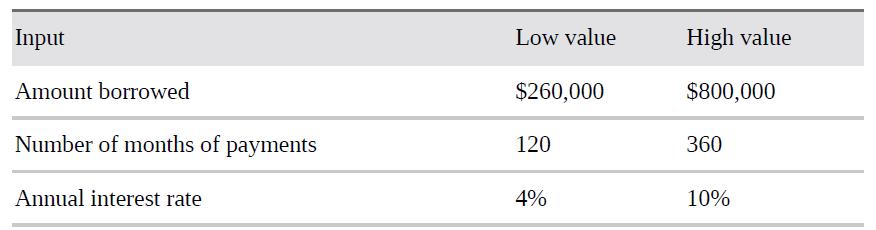
Using the mortgage payment example in Chapter 17, create spin buttons that allow inputs to vary within the following ranges: Input Amount borrowed Number of months of payments Annual interest rate Low value $260,000 120 4% High value $800,000 360 10%
Set up conditional formatting that colors the cell range A1:H8 like a checkerboard, with alternating white and black coloring. The =ROW() function gives the row number of a cell, and the =COLUMN() function gives the column number of a cell.
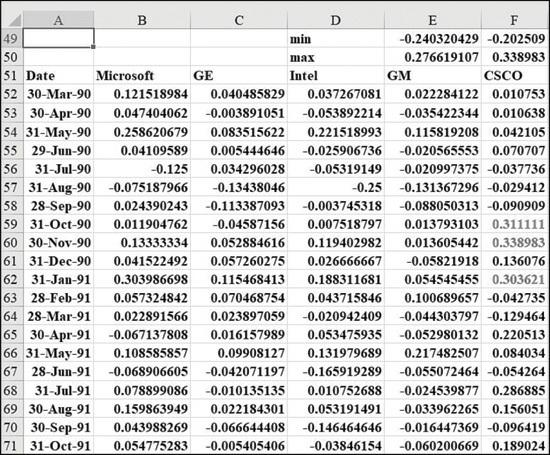
Use the data in the file named Stock.xlsx to construct histograms for monthly returns for GE and Intel. A 49 50 51 Date B Microsoft GE min max Intel D E F -0.240320429 -0.202509 0.276619107 0.338983 CSCO 0.037267081 0.047404062 -0.003891051 -0.053892214 0.083515622
The file named Problem12data.xlsx contains in a single cell a state’s name and population. Use Excel formulas to extract the population to a new column. If a new row is added, then your formulas should automatically work on the new data. You may assume no state name consists of more than two
The file named Problem13data.xlsx contains sales data on 2,000 companies. Write formulas to count the number of banking firms and calculate the fraction of banking revenue earned by banks making at least $20 billion. Your answers should automatically update if new rows of data are added.
Add a spin button for the car NPV example that allows you to vary the tax rate between 30 percent and 50 percent.
Add a spin button for the car NPV example that allows you to vary the interest rate between 5 percent and 20 percent.
The Format Control dialog box allows a minimum value of 0. Despite this limitation, can you figure out a way to use a spin button to vary sales growth between –10 percent and 20 percent?
For the weekend example used in Chapter 24, “Conditional formatting,” set up a check box that turns conditional formatting on or off.
In the financial formulas described in Chapter 10, “More Excel financial functions,” I used a last argument of 1 to indicate end-of-month cash flows and 0 to indicate beginning-of-month cash flows. Excel recognizes True as equivalent to 1 and False as equivalent to 0. Set up a worksheet in
Using the data for Problem 14 in Chapter 22, “The OFFSET function,” create a spinner that lets you graph the last few months of sales (ranging from three to eight months).Data from in problem 14The file named Yeartodate.xlsx contains a company’s monthly sales from January 2008 through August
The file named Suppliers.xlsx contains the unit price you pay to each of your suppliers and the units purchased. Create a list box that allows you to pick the supplier and that also returns the unit price and units purchased.
The file named Kingslineups.docx contains performance ratings for some of the Sacramento Kings lineups. Import this data into Excel.
In the example discussed in this chapter, the time each lineup played (column H) ends with an m. Modify the file so that the time played by each lineup is an actual number.
The website https://www.loc.gov/rr/print/list/057_chron.html contains information about each US president. Create a web query that places each president’s start year and end year in a separate column and lists the first lady but not the vice president.
Use the data in the file named Stock.xlsx to generate descriptive statistics for Intel and GE stock. A 49 50 51 Date B Microsoft GE min max Intel D E F -0.240320429 -0.202509 0.276619107 0.338983 CSCO 0.037267081 0.047404062 -0.003891051 -0.053892214 0.083515622
Use your answer to Problem 1 to compare the monthly returns on Intel and GE stock.Data from in Problem 1Use the data in the file named Stock.xlsx to generate descriptive statistics for Intel and GE stock. A 49 50 51 Date B Microsoft GE min max Intel D E F -0.240320429 -0.202509 0.276619107
The website https://en.wikipedia.org/wiki/List_of_largest_companies_in_the_United_States_by_revenue contains data on the 500 largest US companies. Create a web query that includes the company name, revenue, industry, number of employees, and state where its headquarters are located.
Using the website listed in Problem 2, create a web query that ranks firms according to revenue per employee. You might need to delete the first row (from the Home tab) and, in the Transform tab, change the data type for revenue and employees to Whole Number.Data from in Problem 2The website
The workbook PQPROBLM4DATA.XLSX contains product sales for January through April in tabular format. Use the Power Query Editor to flatten this table.
The workbook PQPROBLEM5DATA.XLSX contains product sales in a flat file. Use the Power Query Editor to put the data in a tabular format.
The workbook PQPROBLEM6DATA.XLSX contains statistics on NBA players. Use the Power Query Editor to insert each player’s team and also to place their individual statistics in separate rows.
Use the LARGE or SMALL function to sort the annual stock returns in the file Historicalinvest.xlsx. What advantage does this method of sorting have over clicking the Sort button? 6 7
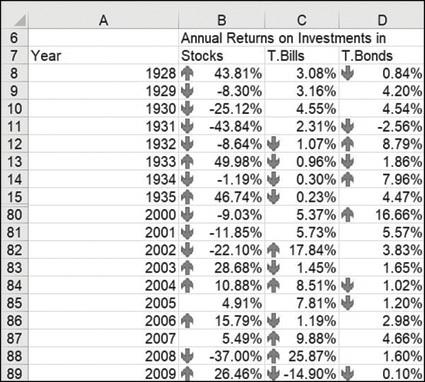
Use descriptive statistics to compare the annual returns on stocks, T-bills, and corporate bonds. Use the data contained in the file Historicalinvest.xlsx. 6 7 Year 8 9 10 11 12 13 14 15 80 81 82 83 84 85 86 87 88 89 A 1928 1929 1930 1931 1932 43.81% 3.08% -8.30% 3.16% -25.12% 4.55% -43.84%
The workbook PQPROBLEM7DATA.XLSX contains sales data from all four quarters of a year in separate worksheets. Use the Power Query Editor to combine the data.
Use the geometric mean to estimate the mean annual return on stocks, bonds, and T-bills in the file named Historicalinvest.xlsx. 6 7 Year 8 9 10 11 12 13 14 15 80 81 82 83 84 85 86 87 88 89 A 1928 1929 1930 1931 1932 43.81% 3.08% -8.30% 3.16% -25.12% 4.55% -43.84%
Use the data in the file named Historicalinvest2009.xlsx to create histograms for annual returns on stocks and bonds. Then compare the annual returns of these stocks and bonds.
The file named Deming.xlsx contains the measured diameter (in inches) for 500 rods produced by Rodco, as reported by the production foreman. A rod is considered acceptable if it is at least 1 inch in diameter. In the past, the diameter of the rods produced by Rodco followed a symmetric histogram.
Compare the mean, median, and trimmed mean (trimming 10 percent of the data) of the annual returns on stocks, T-bills, and corporate bonds given in the file named Historicalinvest.xlsx. 6 7
The file named Unemployment.xlsx contains monthly US unemployment rates. Create a histogram from the data. Are the unemployment rates symmetric or skewed?
The file named Teams.xlsx contains runs scored by Major League Baseball teams during a season. Create a histogram from the data. Are the runs scored symmetric or skewed?
The file named Nflpoints.xlsx contains points scored by NFL teams during a season. Create a histogram from the data. Are the points scored symmetric or skewed?
Using the data in the file named Problem7data.xlsx, create a histogram that summarizes the heights of American men.
The data in the file named Problem8data.xlsx contains the points scored by each Division I NCAA football team during the 2015 season. Create a histogram to summarize this data. Does the data appear to be symmetric?
The data in the file named Problem9data.xlsx contains income of families in Smalltown, USA. Create a Pareto chart to summarize the family incomes.
City Power & Light produces voltage-regulating equipment in New York and ships the equipment to Chicago. A voltage regulator is considered acceptable if it can hold a voltage of 25 to 75 volts. The voltage held by each unit is measured in New York before the unit is shipped. The voltage is
In the file named Decadeincome.xlsx, you are given a sample of incomes (in thousands of 1980 dollars) for a set of families sampled in 1980 and 1990. Assume that these families are representative of the whole United States. Some Republicans claim that the country was better off in 1990 than in 1980
In 1969 and 1970, eligibility for the US armed-services draft was determined on the basis of a draft-lottery number. The number was determined by birth date. A total of 366 balls, one for each possible birth date, were placed in a container and shaken. The first ball selected was given the number 1
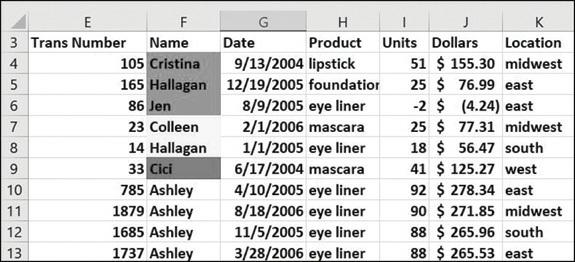
In the Makeupsort.xlsx file, sort the sales data alphabetically by location, then by product type, then by name, then by date of sale, and finally by units sold. E 3 Trans Number 4 5 6 7 8 9 10 11 12 13 F Name 105 Cristina 165 Hallagan 86 Jen 23 Colleen 14 Hallagan 33 Cici 785 Ashley 1879
The file named Jordan.xlsx gives (hypothetical) starting salaries of all 1984 geography graduates from the University of North Carolina (UNC). What is your best estimate of a “typical” starting salary for a geography major? (In reality, the major at UNC with the highest average starting salary
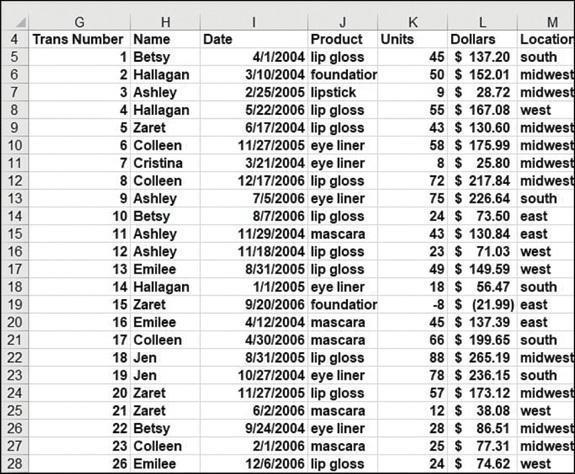
How many units of lip gloss did Colleen sell outside the West region? G H 4 Trans Number Name 5 6 7 8 9 10 11 123 12 13 14 15 16 17 18 19 20 21 22 23 24 25 26 27 28 1 Betsy 2 Hallagan 3 Ashley 4 Hallagan 5 Zaret 6 Colleen 7 Cristina 8 Colleen 9 Ashley 10 Betsy 11 Ashley 12 Ashley 13 Emilee 14
Using the data in the file named Makeupdb.xlsx, how many units of lip gloss did Zaret sell during 2004 and 2005? G H 4 Trans Number Name 5 6 7 8 9 10 11 123 12 13 14 15 16 17 18 19 20 21 22 23 24 25 26 27 28 1 Betsy 2 Hallagan 3 Ashley 4 Hallagan 5 Zaret 6 Colleen 7 Cristina 8 Colleen 9 Ashley 10
Create a data table that contains each person’s total revenue and units sold. G H 4 Trans Number Name 5 6 7 8 9 10 11 123 12 13 14 15 16 17 18 19 20 21 22 23 24 25 26 27 28 1 Betsy 2 Hallagan 3 Ashley 4 Hallagan 5 Zaret 6 Colleen 7 Cristina 8 Colleen 9 Ashley 10 Betsy 11 Ashley 12 Ashley 13
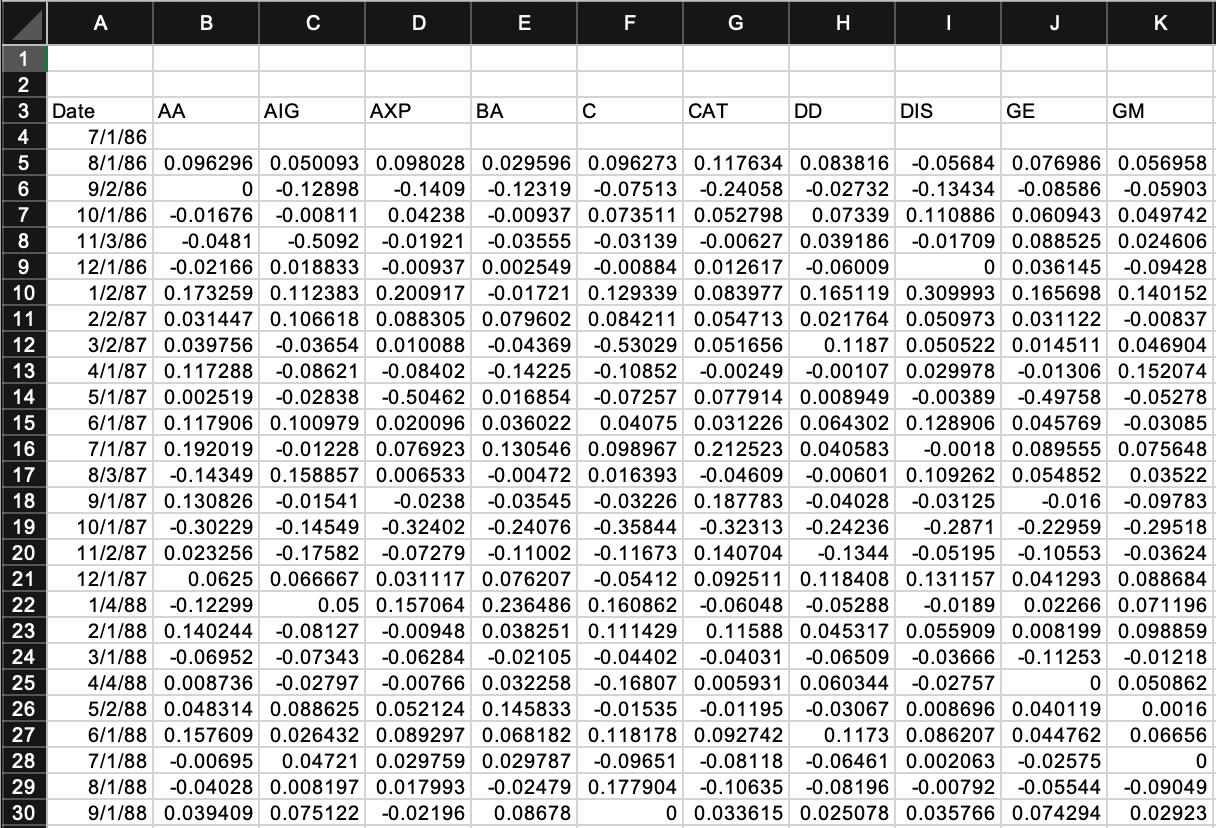
The file Dow.xlsx contains monthly returns on 30 Dow stocks during the past 20 years. Use this data to determine the three stocks with the largest mean monthly returns.
Using the Dow.xlsx data, determine the three stocks with the most risk or variability.
Using the Dow.xlsx data, determine the three stocks with the highest skew. 1 2 3 4 5 69 8 9 10 11 12 13 14 15 16 17 18 19 20 21 22 23 24 25 26 27 28 29 30 A Date AA B AIG C AXP D BA E C F G 0 CAT DD H DIS | GE J GM K 7/1/86 8/1/86 0.096296 0.050093 0.098028 0.029596 0.096273 0.117634 0.083816
Use the data in the file named Makeupdb.xlsx to create a data table that shows the average per-unit revenue generated by each person for sales in which the average per-unit price exceeded $3.30. G H 4 Trans Number Name 5 1 Betsy 2 Hallagan 3 Ashley 4 Hallagan 5 Zaret 6 Colleen 7 Cristina 8
Using the Dow.xlsx data, determine how the trimmed-mean returns (trim off 10 percent of the returns) differ from the overall mean returns.
The file named Incomedata.xlsx contains incomes of a representative sample of Americans in the years 1975, 1985, 1995, and 2005. Describe how US personal income has changed over this time period.
The file named Coltsdata.xlsx contains yards gained by the 2006 Indianapolis Colts on each rushing and passing play. Describe how the outcomes of rushing plays and passing plays differ.
In the file Makeupdb.xlsx, find all the unique combinations of name, product, and location occurring during the first three months of 2006. G H 4 Trans Number Name 5 6 7 8 9 10 11 123 12 13 14 15 16 17 18 19 20 21 22 23 24 25 26 27 28 1 Betsy 2 Hallagan 3 Ashley 4 Hallagan 5 Zaret 6 Colleen 7
In the file named Problem17datat.xlsx, you are given daily returns on Facebook stock. Use this data to answer the following questions: Do Facebook stock returns exhibit significant skewness?Identify all the outliers (using the rule of thumb). Is the number of outliers consistent with the rule
One theory in brain science states that the level of dopamine in a person’s nervous system determines whether someone will exhibit psychotic behavior. In the file named Problem18data.xlsx, you are given the dopamine levels for 10 psychotic and 14 nonpsychotic adults. Use descriptive statistics
Participants in a group of 508 people were asked to estimate the percentage of African nations that are members of the United Nations. A wheel of fortune containing the numbers 1 through 100 was spun before people answered the question. Unknown to the people, the wheel was rigged to show either 25
Use the data in the file Historicalinvest.xlsx to create a count of the number of years in which stock, bond, and T-bill returns are from –20 percent through –15 percent, –15 percent through –10 percent, and so on. 6 7
The Sortday.xlsx file contains hours worked on different days of the week. Sort the data so that the Monday data is followed by the Tuesday data, and so on.
In the Makeupdb.xlsx file, what was the average number of lipstick units sold by Jen in the East region? G H 4 Trans Number Name 5 1 Betsy 2 Hallagan 3 Ashley 4 Hallagan 5 Zaret 6 Colleen 7 Cristina 8 Colleen 9 Ashley 6 7 8 9 10 11 123 12 13 14 15 16 17 18 19 20 21 22 23 24 25 26 27 28 10 Betsy 11
The Sorticons.xlsx file contains annual investment returns with an up arrow used to indicate good years, a horizontal arrow used to indicate average years, and a red arrow used to indicate bad years. Sort the data by the icons in the Stock column with the up arrows on top, followed by the
In the Makeupdb.xlsx file, how many dollars of sales were made by Emilee or in the East region? G H 4 Trans Number Name 5 1 Betsy 2 Hallagan 3 Ashley 4 Hallagan 5 Zaret 6 Colleen 7 Cristina 8 Colleen 9 Ashley 6 7 8 9 10 11 123 12 13 14 15 16 17 18 19 20 21 22 23 24 25 26 27 28 10 Betsy 11 Ashley 12
The file named Makeupsortfont.xlsx contains our makeup data with certain dates shown in blue, red, or brown font. Sort the data so that the brown dates are on top, followed by the red dates and then the blue dates.
In the Makeupdb.xlsx file, how many dollars’ worth of lip gloss did Jen sell? G H 4 Trans Number Name 5 1 Betsy 2 Hallagan 3 Ashley 4 Hallagan 5 Zaret 6 Colleen 7 Cristina 8 Colleen 9 Ashley 6 7 8 9 10 11 123 12 13 14 15 16 17 18 19 20 21 22 23 24 25 26 27 28 10 Betsy 11 Ashley 12 Ashley 13
Sort the sales data in workbook Chapter32Problem5data.xlsx in ascending order of units sold and, in case of ties, alphabetically A–Z by product name.
Perform a case-sensitive A–Z sort by name on the data in the workbook Chapter32Problem6data.xlsx.
In the Makeupdb.xlsx file, how many dollars’ worth of lipstick were sold by Colleen or Zaret in the East region? G H 4 Trans Number Name 5 6 7 8 9 10 11 123 12 13 14 15 16 17 18 19 20 21 22 23 24 25 26 27 28 1 Betsy 2 Hallagan 3 Ashley 4 Hallagan 5 Zaret 6 Colleen 7 Cristina 8 Colleen 9 Ashley 10
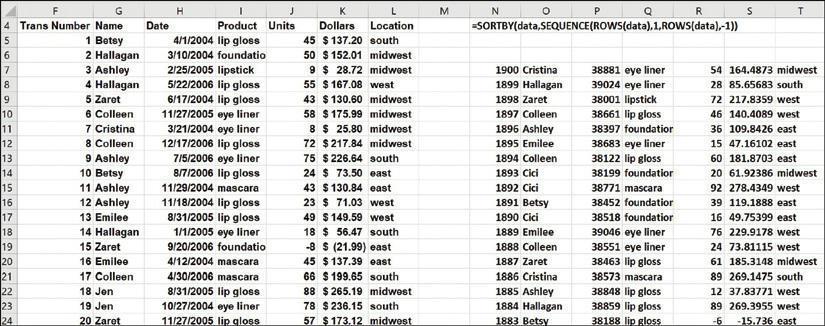
List all the salespeople.Each row gives the salesperson, product sold, units sold, and revenue from a sales transaction. In all cases, make sure your answers will automatically update if new data is added. F G 4 Trans Number Name: 5 6 7 8 9 10 11 12 13 14 15 16 17 18 19 20 21 22 23 24 1 Betsy 2
List all salesperson/product/units combinations.Each row gives the salesperson, product sold, units sold, and revenue from a sales transaction. In all cases, make sure your answers will automatically update if new data is added. F G 4 Trans Number
Showing 200 - 300
of 914
1
2
3
4
5
6
7
8
9
10
Step by Step Answers