New Semester
Started
Get
50% OFF
Study Help!
--h --m --s
Claim Now
Question Answers
Textbooks
Find textbooks, questions and answers
Oops, something went wrong!
Change your search query and then try again
S
Books
FREE
Study Help
Expert Questions
Accounting
General Management
Mathematics
Finance
Organizational Behaviour
Law
Physics
Operating System
Management Leadership
Sociology
Programming
Marketing
Database
Computer Network
Economics
Textbooks Solutions
Accounting
Managerial Accounting
Management Leadership
Cost Accounting
Statistics
Business Law
Corporate Finance
Finance
Economics
Auditing
Tutors
Online Tutors
Find a Tutor
Hire a Tutor
Become a Tutor
AI Tutor
AI Study Planner
NEW
Sell Books
Search
Search
Sign In
Register
study help
business
microsoft excel data analysis 7th
Microsoft Excel Data Analysis And Business Modeling 7th Edition Wayne Winston - Solutions
Use the data in the file named Sales.xlsx to determine the following:Total dollar sales in the MidwestTotal dollars that Heather sold in the EastTotal dollars that Heather sold or that were sold in the EastTotal dollars sold in the East by Heather or JohnNumber of transactions in the East
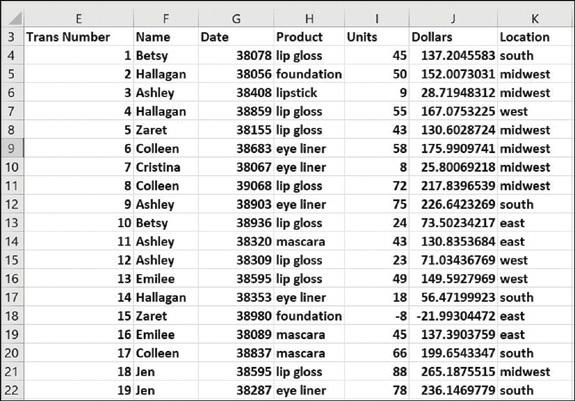
List all salesperson/product/units combinations that occur exactly once.Each row gives the salesperson, product sold, units sold, and revenue from a sales transaction. In all cases, make sure your answers will automatically update if new data is added. F G 4 Trans Number
The file named Housepricedata.xlsx contains the following information for selected homes:Square footagePriceNumber of bathroomsNumber of bedroomsUse this information to answer the following questions:What is the average price of all homes having a total number of bathrooms and bedrooms greater than
The file named Deciles.xlsx contains the unpaid balance for 20 accounts. Use DBASE functions to compute the total unpaid balances in each decile. 8. In the file Makeupdb.xlsx, find all the unique combinations of
Find all transactions where Liam sold candy.Each row gives the salesperson, product sold, units sold, and revenue from a sales transaction. In all cases, make sure your answers will automatically update if new data is added. F G 4 Trans Number
Find all transactions where Ava was the salesperson or magazines were sold.Each row gives the salesperson, product sold, units sold, and revenue from a sales transaction. In all cases, make sure your answers will automatically update if new data is added. F G 4 Trans Number
The Duplicate worksheet in the Chapter35data.xlsx file contains two lists of names. Use an array formula to count the number of names appearing on both lists.
The Find Errors worksheet in the Chapter35data.xlsx file contains some calculations. Use an array formula to count the number of cells containing errors.
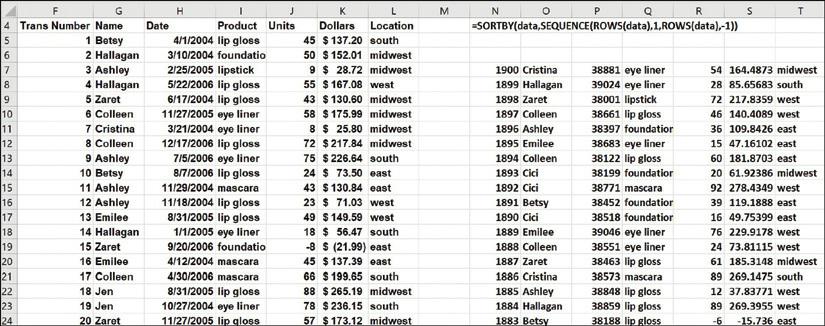
Sort the data in descending order of units, breaking ties based on dollars in descending order.Each row gives the salesperson, product sold, units sold, and revenue from a sales transaction. In all cases, make sure your answers will automatically update if new data is added. F G 4 Trans Number
Sort the transactions in descending order of units.Each row gives the salesperson, product sold, units sold, and revenue from a sales transaction. In all cases, make sure your answers will automatically update if new data is added. F G 4 Trans Number
The Sales worksheet in the Chapter35data.xlsx file contains 48 months of sales at a toy store. Create an array formula to add (beginning with Month 3) every fifth month of sales.
Also in the Sales worksheet in the Chapter35data.xlsx file, use an array function to compute the third, fifth, and seventh power of each month’s sales.
The Product worksheet in the Chapter35data.xlsx file contains sales during April through August of products 1 through 7. Sales for each product are listed in the same column as each month. Rearrange the data so that sales for each month are listed in the same row and any changes to the original
Find all transactions involving 39 units and sort them in descending order of revenue.Each row gives the salesperson, product sold, units sold, and revenue from a sales transaction. In all cases, make sure your answers will automatically update if new data is added. F G 4 Trans Number
The Lillydata.xlsx file contains information from a market-research survey that was used to gather insights to aid in designing a new blood-pressure drug. Fifteen experts (six from Eli Lilly and Company and nine from other firms—see column N) were asked to compare five sets of four potential
The file Arrayexam1data.xlsx contains sales data by company and date. Your job is to break the sales down on a quarterly basis by using array formulas. Summarize the data using only array formulas by company and by quarter. For example, L7 should contain Quarter 1 (January 1 through March 31) ACS
Explain why entering the formula =SUM(1/COUNTIF(Info,Info)) will yield the number of unique entries in the range Info. Apply this formula to the data in the file named Unique.xlsx and verify that it returns the number of unique entries.
The file Salaries.xlsx contains the salaries of NBA players. Write an array formula that adds the four largest player salaries.
For an N-month $100,000 loan with monthly payments at a 10 percent annual rate, use the SEQUENCE function to determine each month’s contribution to principal and interest. If you change the number of months in the loan, your spreadsheet should display the correct information for an N-month
Use the SEQUENCE function to list all integers from 1 to 10,000 in 1,000 rows and 10 columns.Each row gives the salesperson, product sold, units sold, and revenue from a sales transaction. In all cases, make sure your answers will automatically update if new data is added.
You want to enter nonnegative whole numbers in the cell range C1:C20. Set up data validation to ensure that each entry is a nonnegative whole number.
You are entering the dates of transactions that occurred during July 2004 in the cell range C1:C15. Set up data validation to ensure that each date entered occurs in July 2004.
Using the List option in the Allow drop-down menu found in the Settings tab of the Data Validation dialog box, you can generate an error message if a value that is not included in a list is entered in the cell range you’re validating. Suppose you’re entering employee first names in the cell
With the Text Length option in the Allow drop-down menu found in the Settings tab of the Data Validation dialog box, you can generate an error message when the number of characters in a cell does not match the number you define. Use this option to ensure that each cell in the range C1:C10 will
You are entering employee names in the cell range A1:A10. Use data validation to ensure that no employee’s name is entered more than twice.
Suppose you want every entry in the cell range B2:B15 to contain text and not a numerical value. Use data validation to ensure that entering a numerical value returns an error.
Set up data validation to ensure that all numbers typed in column E will contain exactly two decimal places.
The file named Latitude.xlsx contains a formula to compute the distance between two cities using their latitude and longitude. The file also contains the latitude and longitude of various US cities. Set up a drop-down menu so that when you select a city in cell P2 and another city in cell Q2, the
Ensure that if new cities are added to the list of cities in Problem 9, the drop-down menu will include them.Data from in problem 9The file named Latitude.xlsx contains a formula to compute the distance between two cities using their latitude and longitude. The file also contains the latitude and
In the file named Weekendformatting.xlsx, highlight all weekdays in red, and highlight in blue all days that occur in the first 10 days of the month. Which color takes precedence when both colors are applied to one cell?
The file named Test.xlsx contains exam scores for students. The top 10 students received an A, the next 20 students received a B, and all other students received a C. Highlight the A grades in red, the B grades in green, and the C grades in blue. A 3
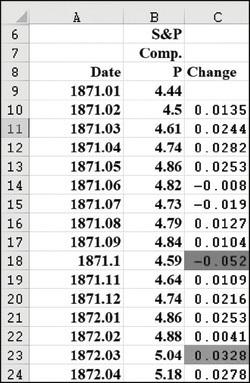
Using the data in the file named Sandp.xlsx, use conditional formatting in the following situations:Format in bold each month in which the value of the S&P index increased, and format with an underline each month in which the value of the S&P index decreased. Highlight in green each month
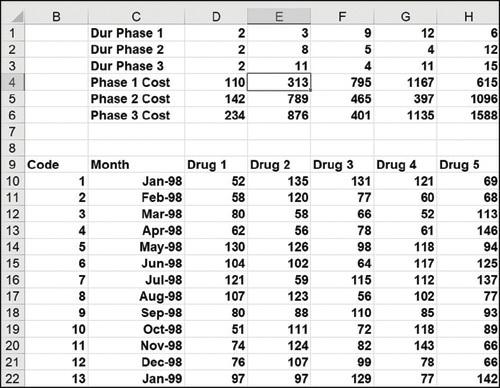
For our drug cost example (see the file named Offsetcost.xlsx from Chapter 22, “The OFFSET function,”), format the worksheet so that all Phase 1 costs are displayed in red, all Phase 2 costs are displayed in green, and all Phase 3 costs are displayed in purple. 123456700 o 8 9
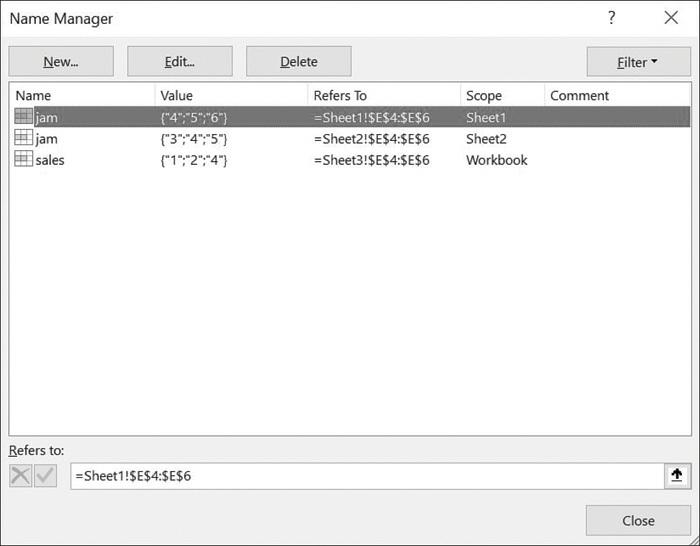
The file Names.xlsx contains a list of names. Highlight all the duplicates in green and all the names containing Ja in red. Name Manager New.... Name jam jam sales Edit... Value {"4":"5","6"} ("3":"4":"5") {"1":"2":"4"} Refers to: XV =Sheet1!$E$4:$E$6 Delete Refers
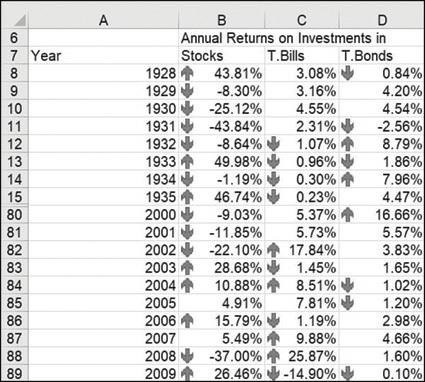
In the file named Historicalinvest.xlsx, set up conditional formatting with three icons so that 10 percent of returns have an up arrow, 10 percent have a down arrow, and 80 percent have a horizontal arrow. 6 7
Write a formula that will total the entries in the cell range G2:K2, even if you insert one or more columns between columns G and K.
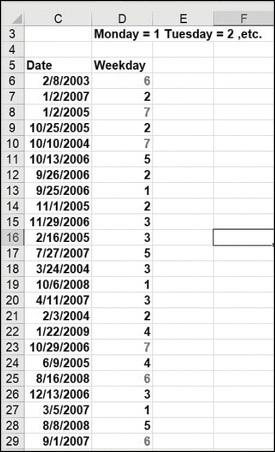
The file named Marketbasketdata.xlsx contains sales of various items. For each row, a 1 in columns B through K indicates a purchased item, whereas a 0 marks an item that was not purchased. In the Day Week column, a 1 means the transaction was on a Monday, a 2 means the transaction was on a Tuesday,
The file named Verizonindirectdata.xlsx contains each employee’s hours of work and employee rating for January–May. Set up a consolidation sheet that enables you to choose any person and then gather that person’s hours of work during each month, along with his or her overall rating for the
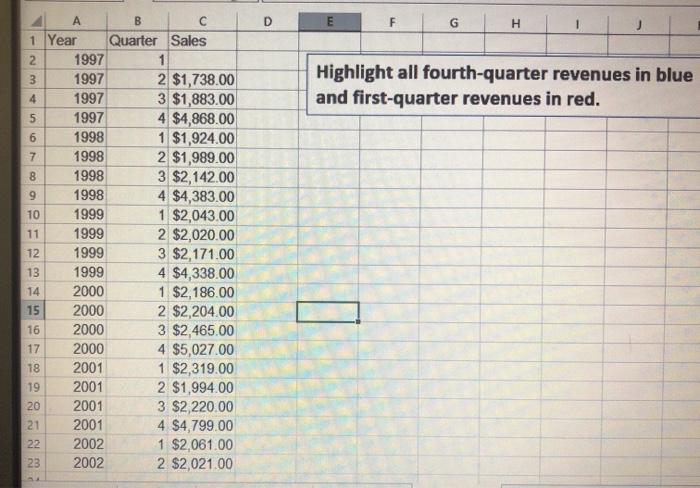
Using the data in the file named Toysrusformat.xlsx, highlight in red all quarters for which revenue has increased over at least the last two quarters. Highlight all fourth quarter revenues in blue and first-quarter revenues in red. 1 Year 2 3 4 5 6 7 8 9 10 11 12 13 14 15 16 1899 17 20 21 222 A
Suppose each worker in Microsoft’s finance department has been assigned to one of four groups. The supervisor of each group has rated each worker on a scale of 0 to 10, and each worker has rated his satisfaction with each of the four groups. (See the file named Satissuper.xlsx.) Based on the
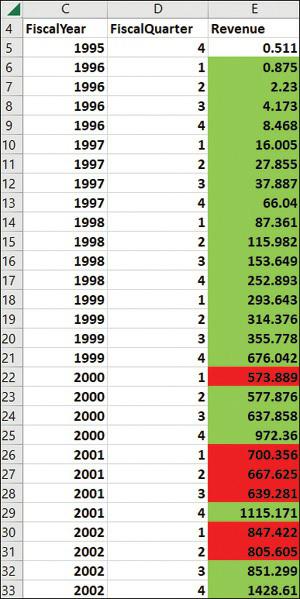
The file named Amazon.xlsx contains quarterly revenues for Amazon.com. Use conditional formatting to ensure that the sales during each quarter are highlighted in a different color. 4 Fiscal
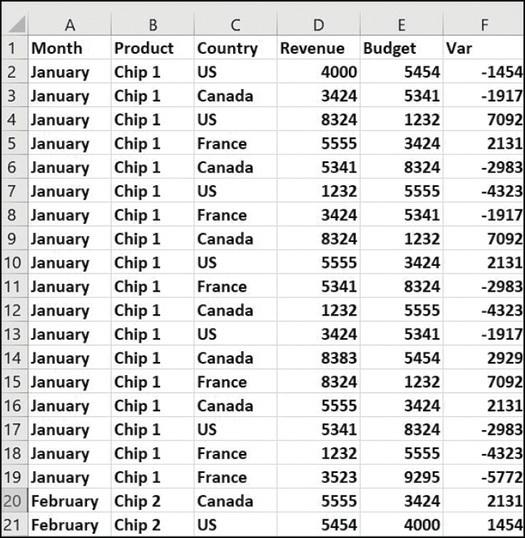
The file named Varianceanalysis.xlsx contains monthly profit forecasts and monthly actual sales. The sales variance for a month equals (Actual Sales – Predicted Sales) / Predicted Sales. Highlight in red all the months with a favorable variance of at least 20 percent; highlight in green all the
The file named Duedates.xlsx contains due dates for various invoices. Highlight in red all invoices due by the end of the next month.
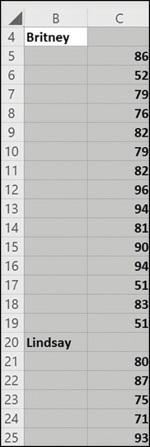
The file named Accountsums.xlsx (see Figure 24-35) shows weekly salaries in thousands of dollars (listed in chronological order) paid to several top-notch consultants. For example, Britney made $91,000 during the first week and made $57,000 during the last week. Follow these steps:Use the formula
The file named Nbasalaries.xlsx contains salaries of NBA players in millions of dollars. Set up data bars to summarize this data. Players making less than $1 million should have the shortest data bar, and players making more than $15 million should have the longest data bar.
Set up a three-color scale to summarize the NBA salary data. Change the color of the bottom 10 percent of all the salaries to green and the top 10 percent to red.
Use five icons to summarize the NBA player data. Create break points for icons at $3 million, $6 million, $9 million, and $12 million.
How could you set things up so that no icons are shown for players who have salaries between $7 million and $8 million?
Using the data in the file named Amazon.xlsx, highlight quarters in which sales exceeded the sales during each of the last two quarters. 4 Fiscal
The file named Fractiondefective.xlsx contains the percentage of defective units produced daily. A day’s production is considered acceptable if 2 percent or less of the items produced are defective. Highlight all the acceptable days with a green flag. Then, in another worksheet, highlight all the
The file Globalwarming2011.xlsx contains average world temperatures in degrees Celsius for the years 1881 through 2011. Use color scales to ensure lower temperatures are colored blue, intermediate temperatures are colored yellow, and higher temperatures are colored red.
Suppose you are saving for your child’s college fund. You are going to contribute the same amount of money to the fund at the end of each year. Your goal is to end up with $100,000. For annual investment returns ranging from 4 percent to 15 percent, and number of years investing varying from 5 to
When students take Vivian’s accounting exam, they are told to enter their email aliases on a Scantron. Often, they make mistakes. Vivian has a list of the actual email aliases for the students in the class. She would like to highlight in yellow the email aliases entered by students that are not
The file named Top5.xlsx contains the annual revenues of 50 companies. For each year, highlight the companies that have the five largest revenues.
The file named Threetimes.xlsx contains a list of names. Highlight in red each name that appears at least three times.
The file named GNP.xlsx contains records of the quarterly US gross national product. Take advantage of the fact that data bars handle negative values to summarize quarterly GNP percentage growth rates.
In the file named Tableexample.xlsx, set things up so that each salesperson’s rank with regard to total revenue and units sold is included in the worksheet. Of course, if new data is included, your ranks should automatically update. You might find it convenient to use the RANK.EQ function. The
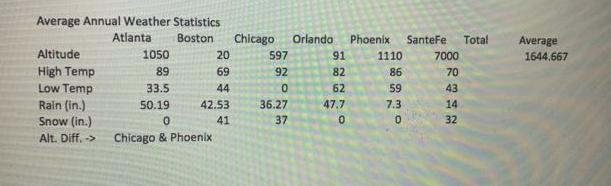
Using the data in the file named Globalwarming2011.xlsx, highlight the years (not the temperatures) in which the temperature is above average. Average Annual Weather Statistics Atlanta Boston Altitude High Temp Low Temp Rain (in.) Snow (in.) Alt. Diff, -> 1050 89 33.5 50.19 20 69 44 42.53 41 0
The file named Shading.xlsx contains 27 quarters of sales. Shade alternate rows in green and yellow. Then alternate shading with four rows in green and four rows in yellow, and so on.
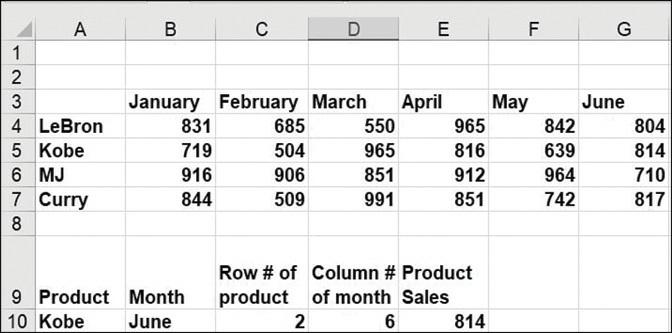
The file named Productlookup.xlsx contains the product sales made each day of the week. Set up a formula that returns the sale of any product on any given day. Of course, if new products are added to the data, your formula should be able to include sales for those products. A 1 2 3 4 LeBron 5
The file named Problem27data.xlsx contains names of several people. A name will be entered in cell E2. Use conditional formatting to highlight each occurrence of the person’s name.
The file named Problem28data.xlsx contains information about voters in 20 congressional districts. In cell I2, we will enter the number of a congressional district. Your job is to set up a format that will highlight all rows of data involving the district listed in cell I2.
For the data in the file named Tablemakeuptemp.xlsx (in this chapter’s Templates folder), determine the total units and revenue for all lip gloss or lipstick sold by Jen or Ashley in the East region. E 3 Trans Number 34567 8 600 9 10 11 12 23 13 14 56 15 16 17 18 19 20 21 22 F Name 1 Betsy 2
In the file named Problem29data.xlsx, columns E–I contain the following information:The opening price of a stockWhether we owned stock at the beginning of the dayWhether we sold the stock that dayWhether we owned the stock at the end of the dayUse conditional formatting to highlight each row of
The file named Problem30data.xlsx contains statistics for 2014 NFL quarterbacks. In cell J21, I will enter a number of yards (x). Use conditional formatting to highlight all information for all quarterbacks whose YDs>=x. For example, if we enter 4500 in cell J2, then any QB with YDS>=4500
In the file named Problem32data.xlsx, you are given information on 2,423 transactions. You believe fraud is likely if either of the following conditions is true:The check amount is at least $500, and nobody authorized the check.The check amount is at least $500, and the same person authorized and
The file named Problem33data.xlsx gives information on 2,000 companies. In K3, a country is entered, and in L3, an industry is entered. Have the spreadsheet highlight all information for companies in the selected country and industry.
The file named Problem34data.xlsx contains addresses to which checks were mailed. If the address involves a PO box, it is likely to have been a fraudulent transaction. Use conditional formatting to highlight all addresses involving a PO box.
The file named Problem35data.xlsx lists in numerical order checks that were cashed. Sometimes a check number was skipped. Use conditional formatting to highlight all checks where the previous check number was not cashed. For example, check 15 should be highlighted because check 14 was not cashed.
The file Problem36data.xlsx contains the following information for many reimbursements: invoice number, amount, and vendor number. Highlight all transactions for which an amount and invoice number occur more than once.
The file named Singers.xlsx contains a list of songs sung by different singers, as well as the length (in estimated minutes) of each song. Set up your worksheet to compute the total number of songs sung by Eminem and the average length of each song. Of course, if new data is added, your formulas
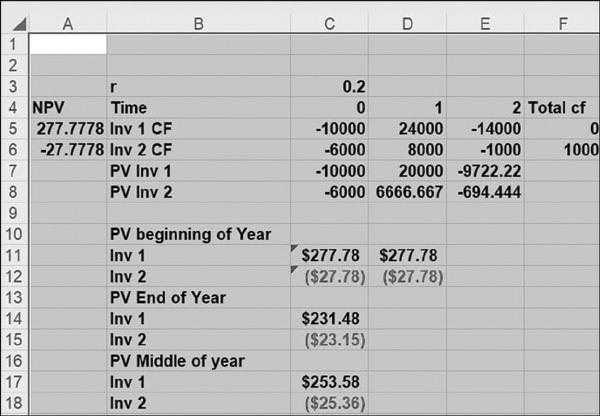
In the file named NPV.xlsx in Chapter 8, “The net present value functions NPV and XNPV,” we found that for high interest rates, Project 1 has a larger NPV, and for low interest rates, Project 2 has a larger NPV. For what interest rate would the two projects have the same NPV?
The file named Lookupdata.xlsx contains product codes and prices. Set up the worksheet so that when a product code is entered, your worksheet will return the product price. Of course, when new products are introduced, your formula should still work.
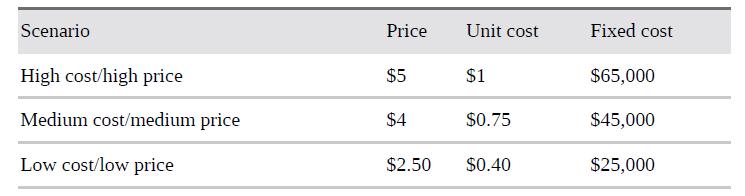
For the lemonade stand example in Chapter 17, “Sensitivity analysis with data tables,” use the Scenario Manager to display a report summarizing profit for the following scenarios: Scenario High cost/high price Medium cost/medium price Low cost/low price Price $5 $4 $2.50 Unit
The file named Tablepie.xlsx contains sales information for different products sold in a small general store. You want to set up a pie chart to summarize this data. Of course, if new product categories are added, the pie chart should automatically include the new data.
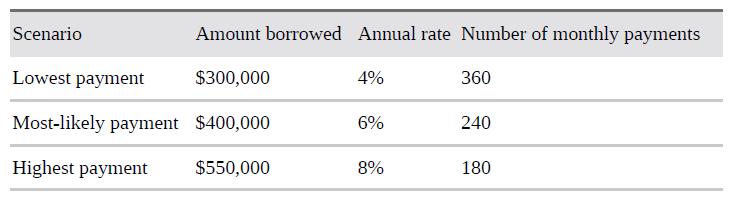
For the mortgage-payment example in Chapter 17, use the Scenario Manager to create a report tabulating monthly payments for the following scenarios: Amount borrowed Annual rate Number of monthly payments Lowest payment $300,000 Most-likely payment $400,000 Highest
The file named Tablexnpvdata.xlsx lists cash flows received by a small business. Set up a formula to compute (as of January 5, 2007) the NPV of all cash flows. Assume an annual discount rate of 10 percent. Of course, if new cash flows are entered, your formula should automatically include them.
The file named Nikedata.xlsx contains quarterly sales revenues for Nike. Create a graph of Nike sales that automatically includes new sales revenue data.
The file named Closest.xlsx contains people’s names and salaries. Set up a worksheet that takes any number and finds the person whose salary is closest to that number. Your worksheet should accomplish this goal even if new names are added or existing names are deleted from the list.
The file named Adagency.xlsx contains salaries and ages of employees of an ad agency. Set up a spreadsheet that will compute the average salary and age of the agency’s employees. Of course, your calculations should automatically update if the agency hires or fires workers.
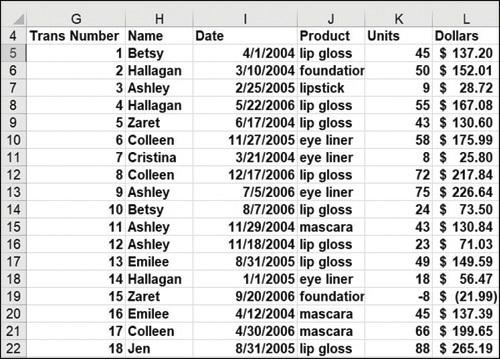
Use the file named Makeup2007.xlsx for questions 10–16.How much revenue was made on sales transactions involving at least 50 units of makeup? G H 4 Trans Number Name 456789 10 11 12 13 14 15 16 17 18 19 222 1 Betsy 2 Hallagan 3 Ashley 4 Hallagan 5 Zaret 6 Colleen 7 Cristina 8 Colleen 9 Ashley 10
The file named Problem11data.xlsx contains statistics on NFL quarterbacks. A QB’s name is entered in cell I2. Set up a format that will highlight the entire row of data for the QB entered in cell I2. Your format should automatically update if new rows of data are added to the worksheet.
In the car NPV example, determine the following:The direct dependents and all the dependents of the interest rate.The direct dependents and all the dependents of the tax rate.The direct precedents and all the precedents for Year 4 unit sales.The direct precedents and all the precedents for Year 3
From the car net present value (NPV) example in Chapter 16, “The auditing tool and the Inquire add-in,” by what rate do annual sales need to grow for total NPV to equal $1 million?
What value of Year 1 unit cost would increase our NPV in the car example in Chapter 16 to $1 million?
Use the file named Makeup2007.xlsx for questions 10–16.Create a table that contains sales of each product made by each person. G H 4 Trans Number Name 456789 10 11 12 13 14 15 16 17 18 19 222 1 Betsy 2 Hallagan 3 Ashley 4 Hallagan 5 Zaret 6 Colleen 7 Cristina 8 Colleen 9 Ashley 10 Betsy 11
Use the file named Makeup2007.xlsx for questions 10–16.How many units of lip gloss did Cici sell in 2004? G H 4 Trans Number Name 456789 10 11 12 13 14 15 16 17 18 19 222 1 Betsy 2 Hallagan 3 Ashley 4 Hallagan 5 Zaret 6 Colleen 7 Cristina 8 Colleen 9 Ashley 10 Betsy 11 Ashley 12 Ashley 13
Three electricians are wiring my new home. Electrician 1 by himself will need 11 days to do the job. Electrician 2 by himself will need 5 days to do the job. Electrician 3 by herself will need 9 days to do the job. If all three electricians work on the job, how long will the job take to complete?
Use the file named Makeup2007.xlsx for questions 10–16.What is the average number of units of foundation sold by Emilee? G H 4 Trans Number Name 456789 10 11 12 13 14 15 16 17 18 19 222 1 Betsy 2 Hallagan 3 Ashley 4 Hallagan 5 Zaret 6 Colleen 7 Cristina 8 Colleen 9 Ashley 10 Betsy 11 Ashley 12
Use the file named Makeup2007.xlsx for questions 10–16.Create a table that, when you enter a year in your worksheet, contains sales of each product by person during that year. G H 4 Trans Number Name 456789 10 11 12 13 14 15 16 17 18 19 222 1 Betsy 2 Hallagan 3 Ashley 4 Hallagan 5 Zaret 6
Use the file named Makeup2007.xlsx for questions 10–16.What is the average dollar size of a foundation sale made by Betsy after the end of 2004? G H 4 Trans Number Name 456789 10 11 12 13 14 15 16 17 18 19 222 1 Betsy 2 Hallagan 3 Ashley 4 Hallagan 5 Zaret 6 Colleen 7 Cristina 8 Colleen 9
Use the file named Makeup2007.xlsx for questions 10–16.In transactions in which Ashley sold at least 40 units of lipstick, what is the total dollar amount? G H 4 Trans Number Name 456789 10 11 12 13 14 15 16 17 18 19 222 1 Betsy 2 Hallagan 3 Ashley 4 Hallagan 5 Zaret 6 Colleen 7 Cristina 8
For the cell range D4:G15, count the cells containing a numeric value. Count the number of blank cells. Count the number of nonblank cells.
The file named NBA.xlsx contains the following information:Columns A and B contain the name of each NBA team and a code number for each team. For example, Team 1 is Atlanta.Column C contains the home team for each game.Column D contains the visiting team for each game.Column E contains points
The file named Matchthesecond.xlsx gives a list of names. Some names occur more than once. Determine the row in which, for example, the second occurrence of the name Dave occurs. Set up a worksheet that allows you to enter a person’s name and a positive integer (such as n) and returns the row in
The file Numbers.xlsx contains a set of numbers. Count how many of these numbers are between 1 and 12 inclusively.
The file named Companydata.xlsx contains information about the 2,000 largest companies in the world. Determine how many of the companies are banks and how many are US banks.
The file named Companydata.xlsx contains information about the 2,000 largest companies in the world. Determine how many banks had sales revenues greater than or equal to $100 billion, greater than or equal to $90 billion, greater than or equal to $10 billion, and so on.
The file named NBA.xlsx contains the following information:Columns A and B list the name of each NBA team and a code number for each team. For example, team 1 is Atlanta, and so on.Column C lists the home team for each game.Column D lists the visiting team for each game.Column E lists points scored
The file named Toysrus.xlsx contains sales revenue (in millions of dollars) during each quarter for the years 1997–2001 and the first two quarters of 2002. Use this data to compute a seasonal index for each quarter of the year. For example, if average sales during the first quarter were 80
Showing 300 - 400
of 914
1
2
3
4
5
6
7
8
9
10
Step by Step Answers