New Semester Started
Get
50% OFF
Study Help!
--h --m --s
Claim Now
Question Answers
Textbooks
Find textbooks, questions and answers
Oops, something went wrong!
Change your search query and then try again
S
Books
FREE
Study Help
Expert Questions
Accounting
General Management
Mathematics
Finance
Organizational Behaviour
Law
Physics
Operating System
Management Leadership
Sociology
Programming
Marketing
Database
Computer Network
Economics
Textbooks Solutions
Accounting
Managerial Accounting
Management Leadership
Cost Accounting
Statistics
Business Law
Corporate Finance
Finance
Economics
Auditing
Tutors
Online Tutors
Find a Tutor
Hire a Tutor
Become a Tutor
AI Tutor
AI Study Planner
NEW
Sell Books
Search
Search
Sign In
Register
study help
business
probability statistics
Statistics For The Behavioral Sciences 4th Edition Gregory J Privitera - Solutions
An SPSS output is given below for the dollars sold of a new product in 10 diff erent markets in the fi rst week following its release. Th e dollars sold in each market (in thousands of dollars) were: 100, 120, 90, 165, 200, 120, 95, 110, 140, and 80. [Please feel free to enter these data in SPSS
An SPSS output is given below for the units sold of a new product in 10 different markets in the first week following its release. The units sold in each market (in thousands of units)were 12, 6, 13, 16, 22, 8, 14, 13, 6, and 20. [Please feel free to enter these data in SPSS and follow the
Suppose we record the following data for the number of miles that a group of students live from campus. After computing the mean, median, and mode, which measure of central tendency is most appropriate to describe these data?a. The median because the mean is substantially larger than the mode.b.
A family counselor records the number of sessions required for children to complete counseling following the loss of a family member. The counselor finds that most boys complete counseling in 12 sessions, whereas most girls attend 15 sessions to complete counseling. Combining the data for boys and
A researcher records the time (in seconds) that participants arrive late for a scheduled research study. Assuming these data are normally distributed, which measure of central tendency is most appropriate to describe these data?a. meanb. medianc. mode
The distribution of annual household income in the U.S. is positively skewed. If the median annual income is about $56,000, we know that the mean annual household income in the U.S. isa. less than the median.b. more than the median.c. equal to the median.
The sum of the squared differences of scores from their mean isa. minimalb. zeroc. negatived. negligible
The fact that the sum of the differences of scores from their mean is zero best illustrates thata. the mean is at the center of a distribution.b. the mean is equal to zero.c. the mean can never be negative.d. the mean is the “balance point” of a distribution.
As part of a larger study, the calories consumed in a meal by five children is recorded. The following calories consumed are recorded: 450, 420, 310, 500, and 220. If the researcher removes the estimate of 220 (say, because one child leaves the camp prior to the study being completed), then the
A researcher studying sensation and perception asks participants to estimate the distance between two points of light. The researcher records the following estimates: 40, 46, 30, 50, and 34. If the researcher removes the estimate of 40 (say, due to an experimenter error), then the value of the mean
A health psychologist observes a sample of athletes, of which 15 play a club sport (n = 15)and 10 play a varsity sport (n = 15). They record the time (in days) it takes to recover from a minor injury and find that club sport athletes took an average of 4 days (M = 4) to recover;varsity sport
A neuroscientist measures the reaction times (in seconds) during an experimental session in a sample of cocaine-addicted (n = 8), morphine-addicted (n = 12), and heroin-addicted(n = 6) rats. Mean reaction times in each sample are 11, 18, and 13 seconds, respectively.What is the weighted mean for
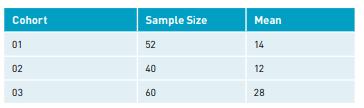
The following are the results from each of three cohorts or samples selected in a study. In this example, which of the following statements is true? Cohort 01 02 03 Sample Size 62 52 40 Mean 14 122 60 28 60
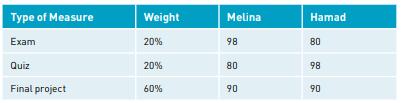
The following are the grades for two students in class. Based on the weights given, which student has the higher grade? Type of Measure Weight Melina Hamad Exam 20% 98 80 Quiz 20% 80 98 Final project 60% 90 90 90
A researcher records the following data for how participants rated their mood (on a scale from 1 = feel very bad to 7 = feel very good) following a video depicting a warm-hearted scene: 5, 4, 7, 6, 6, 4, 6, 7, 2, 5, and 6. Is the mode equal to the median in this example?a. Yes.b. No; the median is
A researcher records the following data for the number of times an speaker is interrupted during a talk given during a class: 0, 0, 3, 2, 5, 3, 0, 8, 0, 2, 1, and 1. Is the mode equal to the median in this example?a. Yes.b. No; the median is larger than the mode.c. No; the mode is larger than the
Which value in this data set represents the balance point or zero point of the distribution?Answer: ____ [enter whole number]
Which of the following can be used to identify the median in this distribution?a. The 50th percentile of a relative percentage distribution.b. The 50th percentile of a cumulative percentage distribution.c. The middle value in a data set listed in random order.
Which of the following statements are true for the data in this distribution?a. The mean is larger than the mode, but not larger than the median.b. The mean is larger than the median, but not larger than the mode.c. The mean is larger than the median and both are larger than the mode.
A researcher records the following data for the number of hours spent off task among employees during a weekend night shift: 3, 1, 5, 0, 4, 5, 2, 1, 1, 4, 2, and 0. Is the mode equal to the median in this example?a. Yes.b. No; the mode is larger than the median.c. No; the median is larger than the
A researcher records the following data for the time (in seconds) it took five animal subjects to cross an electrical grid to obtain reinforcement on the other side: 12, 9, 13, 4, and 12. Is the mean equal to the mode in this example?a. Yes.b. No; the mode is larger than the mean.c. No; the mean is
A researcher records the following data for the number of social media posts made by students following a tragedy: 1, 6, 2, 5, 4, 3, and 7. Is the mean equal to the median in this example?a. Yes.b. No; the median is larger than the mean.c. No; the mean is larger than the median.
A researcher records the following data for the number of errors made on a high-stakes assessment among 10 students: 3, 2, 4, 4, 3, 1, 1, 0, 2, and 0. Is the mean equal to the median in this example?a. Yes.b. No; the median is larger than the mean.c. No; the mean is larger than the median.
Measures of central tendencya. convey information for data in populations and samplesb. help us meaningfully describe what is characteristic of values at or near the center of a distributionc. Both a and b are correct.
What measures are used to summarize scores that have a tendency to fall at or near the center of a distribution?a. ratiob. frequencyc. central tendency
A portion of an SPSS output table is given in the image below for the following data for the duration of time (in seconds) that 20 participants attended to a task: 2, 3, 3, 4, 4, 4, 5, 5, 5, 5, 5, 6, 6, 6, 7, 8, 9, 9, 10, and 12. [Please feel free to enter these data in SPSS and follow the
Options to compute the mean, the median, and the mode are all located in the same dialog box.a. Trueb. False
Using SPSS, which options in the menu bar do you select to compute the mean, the median, and the mode?a. Analyze, then Descriptive Statistics and Exploreb. Analyze, then Descriptive Statistics and Descriptivesc. Analyze, then Descriptive Statistics and Frequencies
The ____ can be informative when used to describe any type of distribution in which one or more scores occur most often. [Fill in the blank]a. meanb. medianc. mode
The mean is a preferred measure for describing skewed distributions.a. True, the mean is the preferred measure.b. False, the median is the preferred measure.
When the mean is greater than the mode, the distribution is negatively skewed.a. True, the mean is always greater than the mode in a negatively skewed distribution.b. False, when the mean is less than the mode, the distribution is negatively skewed.
The mean is a preferred descriptive statistica. for describing normal distributionsb. for summarizing interval scale measuresc. for summarizing ratio scale measuresd. all of the above
Suppose that you sum the squared differences of scores from their mean for a given data set. What is always true about the result you obtain?a. The results will always be equal to 0.b. The result is the smallest possible positive solution. Substituting any constant (other than the mean) will
Which characteristic of the mean indicates that the mean is the “zero point” for a distribution of scores?a. Adding, subtracting, multiplying, or dividing each score in a distribution by a constant will cause the mean to change by that constant.b. The sum of the differences of scores from their
Which of the following will have no effect on the mean?a. Delete a score below the mean.b. Add a score below the mean.c. Add a score exactly equal to the mean.d. None of the above.
Which of the following will increase the value of the mean?a. Delete a score below the mean.b. Add a score below the mean.c. Add a score exactly equal to the mean.d. None of the above.
Which of the following will decrease the value of the mean?a. Delete a score below the mean.b. Add a score below the mean.c. Add a score exactly equal to the mean.d. None of the above.
A researcher observes the following data set: 3, 5, 4, 4, 6, 7, 8, 2, 3, 2, 4, 2, 2, and 4. State the mode(s) in this distribution.a. 2b. 4c. 2 and 4d. There are no modes in this distribution.
The ____ is the value in a data set that occurs most often or most frequently. [Fill in the blank]a. meanb. medianc. mode
What type of distribution can be used to locate the median at the 50th percentile?a. simple frequency distributionb. relative frequency distributionc. cumulative percentage distribution
The ____ is the preferred measure of central tendency when a data set has outliers. [Fill in the blank]a. meanb. medianc. weighted mean
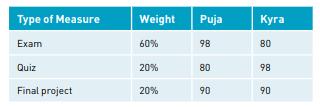
The following are the grades for two students in class. Based on the weights given, which student has the higher grade?a. Pujab. Kyra Type of Measure Weight Puja Kyra Exam 60% 98 80 Quiz 20% 80 98 Final project 20% 90 90 90
A researcher collects two samples of data: the first sample (n = 8) has a mean of 5; the second sample (n = 2) has a mean of 10. What is the weighted mean of these samples?a. 5b. 6c. 7.5d. 10
The ______ is the combined mean of two or more groups of scores in which the number of scores in each group is disproportionate or unequal. [Fill in the blank]a. meanb. weighted meanc. unequal mean
A researcher records the following scores (n = 6): 3, 6, 4, 1, 10, and 12. What is the sample mean of these scores?a. 5.0b. 6.0c. 7.0
The mean is the ______ in a distribution. [Fill in the blank]a. balance pointb. end pointc. middle point
How does the notation differ in the formulas for sample mean (M) and population mean(μ)?a. The term N is used in the denominator for the population mean, and the term n is used in the denominator for the sample mean.b. The term n is used in the denominator for the population mean, and the term N
Why are calculations for measures of central tendency in a sample and a population given unique notation?a. Because samples and populations are similar in terms of their size and therefore are given unique notation.b. Because samples are distinct from populations and therefore are given unique
____ represents the size of a population, whereas ____ represents the size of a sample.[Fill in the blanks]a. N; nb. n; N
Measures of central tendency have a tendency to be at or near the ______ of a distribution. [Fill in the blank]a. tailsb. end pointsc. center
Who sent the greatest number of tweets immediately following the big sports victory?a. studentsb. facultyc. alumni
What type of graphical display is shown in the SPSS output image?a. bar chartb. histogramc. pie chart
Given below are two pie charts for how often users of Facebook (left) and Twitter (right)visit these platforms, among U.S. adults. Using the pie charts, identify which of the following statements are true for the data summarized (reported by the Pew Research Center at
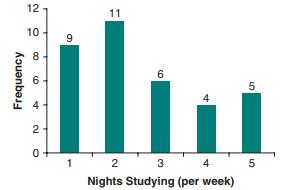
The following bar graph summarizes the number of nights per week a sample of college students spent studying. Based on the data shown, how many students studied at least 4 nights per week? 121 10 9 8 6 Frequency 4 2- 0+ 11 6 1 2 3 4 50 4 5 Nights Studying (per week)
A researcher records the following data: 225, 114, 153, 117, 223, 152, 159, 227, 110, 119, 155, 159, 226, 153, 223, 114, 158, 221, 115, 220. These data are summarized in the following stem-and-leaf display. Identify the missing value for A. 1 10 14 14 15 17 19 52 53 A 55 58 59 59 2 20 20 21 23 23
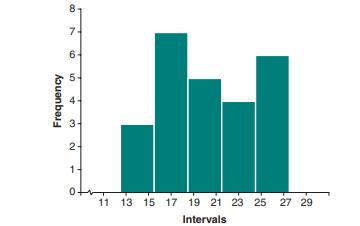
The following histogram lists scores contained within intervals from 12.5 to 27.5. For these data, how many scores fall at or below 21.5? 8. 7- 6- 10 5 Frequency 4 2- 1- 0 11 13 15 17 19 21 23 25 Intervals 27 29
Frequency polygons are plotted at the ________ of each interval, whereas ogives are plotted at the ________ of each interval. [Fill in the blanks]a. midpoint; upper boundaryb. upper boundary; midpointc. right; leftd. left; right
A histogram has the following intervals: 2-4, 5-7, 8-10, and 11-13. If the histogram is converted to a frequency polygon, at what value will the interval for 8–10 be plotted?Answer: ___ [enter whole number]
Which of the following countries has the greatest income equality based on the Gini Index score?a. United States of Americab. South Americac. Canada
In which range does the United States of America fall in terms of income equality using the Gini Index?a. 35–40b. 40–45c. 45–50
What type of summary display uses symbols or illustrations to represent a concept, object, place, or event?a. pictogramb. bar chartc. histogram
Which type of dance were participants in this survey least interested in learning?a. Salsab. Tangoc. Cha-Chad. Swinge. Hip-Hop
Which type of dance were participants in this survey most interested in learning?a. Salsab. Tangoc. Cha-Chad. Swinge. Hip-Hop
In a study on romantic relationships, 240 romantically involved participants were asked to choose their preference for an ideal night out with their partner. Th e frequency of participants choosing (1) dinner and a movie, (2) a sporting event, (3) gambling/gaming, or (4) going out for drinks was
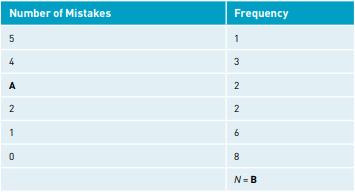
Th e following is an incomplete frequency distribution table for the number of mistakes made during a series of military combat readiness training exercises. If 0, 1, 2, 3, 4, or 5 mistakes were counted, then which of the following correctly identifi es the missing value for A and for B? Number of
A researcher observed a rat respond for a food reward by pressing one of three levers in a cage.Pressing the lever to the right (R) produced no food reward, pressing the lever to the left (L)produced a single food pellet, and pressing the lever at the center (C) produced two food pellets. Because
Half of the times recorded fall at or below and half fall above what value in this distribution?
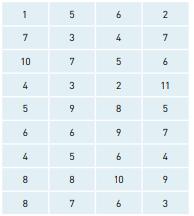
Which of the following lists the original 14 times recorded?a. 1, 2, 3, 1, 2, 1, 1, 2, and 1.b. 60, 65, 76, 80, 82, 88, 92, 94, and 98.c. 60, 65, 65, 76, 76, 76, 80, 82, 88, 88, 92, 94, 94, and 98.d. 60, 65, 65, 76, 76, 76, 80, 82, 82, 88, 92, 94, 94, and 98.
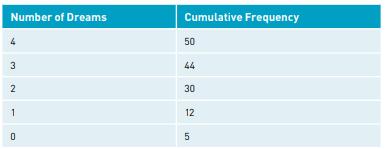
A researcher records the number of dreams that 50 college freshman students recalled during the night prior to a final exam. For these data, what is the number of dreams at the 60th percentile? [Hint: First convert this table to a percentile rank distribution.] Number of Dreams 4 Cumulative
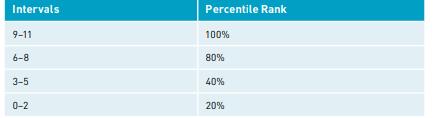
What is the percentile point at the 90th percentile in the following distribution Intervals Percentile Rank 9-11 100% 6-8 80% 3-5 40% 0-2 20%
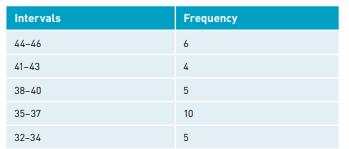
What is the cumulative percentage of scores at or below 37 in this distribution? Intervals Frequency 6 44-46 41-43 38-40 5 35-37 32-34 10 10 5
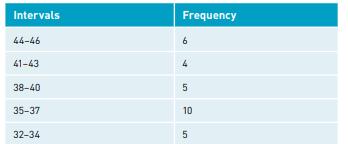
If we convert this frequency distribution to relative percentages, which of the following gives the corresponding relative percentages in each interval?a. 20%, 33%, 50%, 67%, and 100%b. 20%, 13%, 17%, 33%, and 17%c. 20, .33, .50, .67, and 1.00d. 20, .13, .17, .33, and .17 Intervals 44-46 41-43
When cumulating frequencies from the top down, the data are discussed in terms ofa. at mostb. at leastc. at or below
When cumulating frequencies from the bottom up, the data are discussed in terms ofa. at mostb. at leastc. at or above
The upper boundaries for a distribution of waiting times (in seconds) in a grocery store aisle are 45, 56, 67, and 78. Which of the following lists the value for each lower boundary in this distribution?a. 35, 46, 57, and 68b. 45, 56, 67, and 78c. 44, 55, 66, and 77
The lower boundaries for the number of missing assignments among students in a large class are 1, 4, 7, 10, 13, and 16. Which of the following lists the value for each upper boundary in this distribution?a. 1, 4, 7, 10, 13, and 16b. 3, 6, 9, 12, 15, and 18c. 2, 5, 8, 11, 14, and 17
The following table shows a frequency distribution for grouped data. Notice that the frequency of scores, f(x), does not add up to 15. If a total of 15 scores were actually counted, which of the following gives an explanation for why the frequencies do not add up to 15?Intervals Frequency 0–5 4
Below is the number of times a commercial was shown displaying high fat, high sugar foods during children’s programming over a one-month period. For these data, construct a simple frequency distribution for grouped data with four intervals. Which interval has the largest frequency?21, 8, 11, 9,
Which of the following explains why it is valuable to summarize data?a. It can make the presentation of a distribution of data clearer.b. It can make the interpretation of a distribution of data clearer.c. Both a and b are correct.
A professor has 100 students in their class, and 40 students scored between 80 and 89 for a B on the first exam. Which value(s) represents the frequency in this example?a. 40b. 100c. 80–89
True or false: SPSS gives you many options for summarizing data using tables and graphs.a. True.b. False.
Using SPSS, which options in the menu bar can you select to also have the option to create a stem-and-leaf display?a. Analyze, then Descriptive Statistics and Exploreb. Analyze, then Descriptive Statistics and Descriptivesc. Analyze, then Descriptive Statistics and Frequencies
Using SPSS, which options in the menu bar do you select to construct a histogram, bar chart, and pie chart?a. Analyze, then Descriptive Statistics and Exploreb. Analyze, then Descriptive Statistics and Descriptivesc. Analyze, then Descriptive Statistics and Frequencies
The 360 degrees in a pie chart correspond to 100% of a data distribution.a. True.b. False.
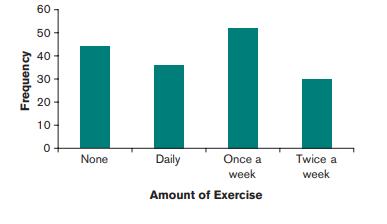
In the following bar chart summarizing the frequency of exercise among a sample of college students, which category of exercise has the largest frequency?a. None.b. Daily.c. Once a week.d. Twice a week. Frequency 60 50- 40 30 20 10- 0 None Daily Once a Twice a week week Amount of Exercise
Which of the following best describes histograms and bar charts?a. They are similar except that the vertical bars do not touch in a bar chart.b. They are similar except that the vertical bars do not touch in a histogram.c. Both are used to summarize qualitative and discrete data.
What are the original scores listed in the following stem-and-leaf display.1 3 3 7 5 4 5a. 13, 17, 54, and 55.b. 13, 13, 17, 54, and 45.c. 13, 13, 17, 54, and 55.
What is a key distinction between a stem-and-leaf display and a histogram?a. A stem-and-leaf display lists actual scores in a distribution; a histogram lists frequencies.b. A histogram lists actual scores in a distribution; a stem-and-leaf display lists frequencies.c. There is no distinction; a
In a stem-and-leaf display, the ____ lists the first digit or digits for each number in each row to the left of the vertical line, and the ____ lists the last digit or digits for each number in each row to the right of the vertical line. [Fill in the blanks]a. leaf; stemb. stem; leaf
An ogive graphically summarizes what type of frequency distribution?a. A cumulative percentage distribution.b. A relative percentage distribution.c. Both a and b.
A(n) ________ is a dot-and-line graph plotted at the midpoint of each interval, whereas a(n) ________ is a dot-and-line graph plotted at the upper boundary of each interval.[Fill in the blanks]a. frequency polygon; ogiveb. ogive; frequency polygon
Histograms are used to summarize discrete data, which is why each vertical rectangle touches the other.a. True, histograms are used to summarize discrete data.b. False, histograms are used to summarize continuous data.
What types of publications are pictograms often reported in?a. magazinesb. newspapersc. research journalsd. all of the above
A pictogram is an effective way to summarize frequency data.a. True, a pictogram is an effective way to summarize frequency data.b. False, pictogram is an ineffective way to summarize frequency data.
A ______ is a summary display that uses symbols or illustrations to represent a concept, object, place, or event. [Fill in the blank]a. pictogramb. symbolismc. cumulative distribution
A professor gives a quiz that is out of 5 possible points (1 point for each correct answer with no partial credit possible). What type of frequency distribution is most appropriate?a. A frequency distribution for grouped data.b. A frequency distribution for ungrouped data.
Ungrouped data can be summarized using what type of frequency distribution?a. Relative frequencyb. Cumulative relative frequencyc. Relative percentaged. Cumulative relative percentagee. All options above.
When will a researcher summarize ungrouped data in a frequency distribution?a. When the dependent variable is qualitative or categorical.b. When the number of different scores is small (i.e., the scores cannot be fit easily into at least 5 intervals).c. Both a and b.
What is the cumulative frequency for a duration at or below 3.00?a. 4b. 7c. 10
What is the cumulative frequency for a duration at or above 3.00?a. 4b. 7c. 10
Showing 5900 - 6000
of 8686
First
53
54
55
56
57
58
59
60
61
62
63
64
65
66
67
Last
Step by Step Answers