New Semester Started
Get
50% OFF
Study Help!
--h --m --s
Claim Now
Question Answers
Textbooks
Find textbooks, questions and answers
Oops, something went wrong!
Change your search query and then try again
S
Books
FREE
Study Help
Expert Questions
Accounting
General Management
Mathematics
Finance
Organizational Behaviour
Law
Physics
Operating System
Management Leadership
Sociology
Programming
Marketing
Database
Computer Network
Economics
Textbooks Solutions
Accounting
Managerial Accounting
Management Leadership
Cost Accounting
Statistics
Business Law
Corporate Finance
Finance
Economics
Auditing
Tutors
Online Tutors
Find a Tutor
Hire a Tutor
Become a Tutor
AI Tutor
AI Study Planner
NEW
Sell Books
Search
Search
Sign In
Register
study help
business
probability statistics
Statistics For The Behavioral Sciences 4th Edition Gregory J Privitera - Solutions
Which missing value indicates the effect size?Answer: ____ [enter Z, P, or D]
Which missing value indicates the value of the test statistic?Answer: ____ [enter Z, P, or D]
In which phase for analyzing inferential statistics in SPSS would we evaluate whether the data were selected from a population with a normal distribution?a. data entryb. evaluating the assumptionsc. computing the test
In which phase for analyzing inferential statistics in SPSS do we compute the test statistic?a. data entryb. evaluating the assumptionsc. computing the test
As a rule, the assumption of normality is met when the kurtosis coefficient is within ±__.[Fill in the blank]Answer: ____ [enter whole number]
As a rule, the assumption of normality is met when the skewness coefficient is within ±__.[Fill in the blank]Answer: ____ [enter whole number]
A researcher conducts study evaluating ranked data and analyzes the data using a test statistic that is appropriate to use even when the data in the population are not normally distributed.Answer: ____ [enter P or N]
A researcher conducts study in which data are analyzed using a test statistic that requires data to be measured on an interval or ratio scale and requires that the data in the population are normally distributed.Answer: ____ [enter P or N]
A researcher conducts two studies. Each study was a one-sample z test. Both studies placed the rejection region in both tails and measured the same sample mean. The beta level in Study 1 was larger than the beta level used in Study 2. Which study is associated with greater power to detect an
A researcher conducts a study, but it has low power to detect an effect. Which of the following is one way in which the researcher can increase power?a. Make the alpha level smaller.b. Increase the sample size.c. Study a population with a larger standard deviation.d. All of these answers are
A researcher conducts a one-sample z test and makes the decision to reject the null hypothesis. Another researcher selects a larger sample from the same population, obtains the same sample mean, and makes the decision to fail to reject the null hypothesis using the same hypothesis test. Is this
A researcher selects a sample of 30 participants and makes the decision to fail to reject the null hypothesis. They conduct the same study using the same population, testing the same hypothesis, but with a sample of 300 participants, and they make the decision to reject the null hypothesis. Which
If the null hypothesis stated that = 4.0, then what would the decision have been for these data using the one-sample z test?a. Reject the null hypothesis.b. Fail to reject the null hypothesis.c. It is not possible to infer significance from a confidence interval.
Which of the following lists the 95% confidence interval for these data?a. 95% CI 5.00, 5.50b. 95% CI 4.76, 5.74c. 95% CI 3.52, 6.48d. 95% CI 4.84, 5.66
Using estimation, which of the following explains why a point estimate is typically reported with an interval estimate?a. Using only a point estimate is associated with low certainty.b. The interval estimate gives researchers a higher level of confidence.c. The interval estimate adds certainty to
Which of the following best describes the goal of estimation?a. To determine the extent to which a result is significant.b. To estimate or determine the effect size of a result.c. To narrow in on the true population mean by defining limits within which it is likely to be contained.
A researcher reports that the size of an effect in some population is d = 0.80. Which of the following is an appropriate interpretation for Cohen’s d?a. There is an 80% likelihood of detecting the significant effect observed in the population.b. 88% of the variability in the dependent variable
What is the effect size using Cohen’s d if the sample size is increased to 100?Answer: ____ [enter number to the hundredths place: .00]
State whether the effect size using Cohen’s d is small, medium, or large. Answer S for small, M for medium, and L for large.Answer: ____ [enter S, M, or L]
What is the effect size using Cohen’s d?Answer: ____ [enter number to the hundredths place: .00]
Effect size is a measure that allows researchers to describea. how far mean scores have shifted in the population.b. the percentage of variance that can be explained by a given variable.c. Both a and b are correct.
A researcher obtains z = 2.08 for a one-sample z test. If the decision was to fail to reject the null hypothesis, then what do you know about the decision?a. The decision was based on a one-tailed and not a two-tailed test.b. The decision was based on a two-tailed and not a one-tailed test.c. The
When a researcher decides to fail to reject the null hypothesis because the rejection region was located in the wrong tail, this is called aa. Type I error.b. Type II error.c. Type III error.
A researcher obtains z = 1.80 for a one-sample z test. What is the decision for this test at a.05 level of significance?a. To reject the null hypothesis.b. To fail to reject the null hypothesis.c. It depends on whether the test is one-tailed or two-tailed.
A researcher obtains z = 2.05 for a one-sample z test. What is the decision for this test at a.05 level of significance?a. To reject the null hypothesis.b. To fail to reject the null hypothesis.c. It depends on whether the test is one-tailed or two-tailed.
What is the decision for the one-sample z test using a two-tailed test at a .05 level of significance?a. Fail to reject the null hypothesis.b. Reject the null hypothesis.
After computing a one-sample z test for these data, what is the value of the z statistic?Answer: ____ [enter number to the hundredths place: 0.00]
Which of the following statements regarding the decision made for this test is true?a. The decision could possibly be a Type I error.b. The decision to fail to reject the null hypothesis means that we can accept the null hypothesis.c. If the test was a one-tailed test at a .05 level of
What is the decision for the one-sample z test using a two-tailed test at a .05 level of significance?a. Fail to reject the null hypothesis.b. Reject the null hypothesis.
After computing a one-sample z test for these data, what is the value of the z statistic?Answer: ____ [enter number to the hundredths place: 0.00]
Using a courtroom analogy, a Type __ error is akin to letting the guilty go free; a Type __ error is akin to putting the innocent in prison. [Fill in the blanks]a. I; II.b. II; I.c. II; III
A Type __ error is akin to a “false positive” finding; a Type __ error is akin to a “false negative” finding. [Fill in the blanks]a. I; II.b. II; I.c. II; III
A researcher reports a null finding, but later it is discovered that the null hypothesis is, in fact, false. What type of error was made by the researcher?a. Type I error.b. Type II error.c. None, an error was not made.
A researcher reports that an effect is significant, then a later discovery shows that the effect was, in fact, not significant. What type of error was made by the researcher?a. Type I error.b. Type II error.c. None, an error was not made.
A researcher reports that “heavy use” of social media can lead to better health outcomes at p = .10. If the level of significance was set at .05, then the effecta. failed to reach significance.b. reached significance.
A researcher reports that a new therapy effectively reduces symptoms of anxiety at p = .03.If the level of significance was set at .05, then what was the decision for this test?a. Fail to reject the null hypothesis.b. Reject the null hypothesis.
A researcher observes a sample and records data that needs to be analyzed. Which of the following can they use to analyze the data?a. a null hypothesisb. a test statisticc. a level of significance
A researcher reports that the probability of a obtaining a sample outcome, given that the value stated in the null hypothesis is true, is .05. What probability did the researcher report?a. alpha levelb. critical valuec. p value
Using null hypothesis significance testing (NHST), all decisions are made about thea. null hypothesis.b. alternative hypothesis.c. Both a and b are correct.
In Step 2 of hypothesis testing we state the criteria for a decision. Which of the following is the criteria we state in Step 2?a. level of significanceb. p valuec. Both a and b are correct.
Which of the following is a statistical procedure used to determine whether or not an effect exists in a population?a. estimationb. hypothesis testingc. effect size
Which of the following is a term used to identify any outcome or phenomenon of interest in science?a. powerb. variancec. effect
The p value is reported with the test statistic of a one-sample z test using APA format.a. Trueb. False
When reporting the results of a one-sample z test using APA format, the ______ does not need to be reported. [Fill in the blank]a. test statisticb. p valuec. effect sized. critical values
SPSS is a user-friendly, point-and-click statistical software used to compute nearly any type of statistic or measure utilized in the behavioral sciences.a. Trueb. False
Which of the following is a phase for properly analyzing most inferential statistics in SPSS?a. Data entryb. Evaluating assumptionsc. Computing the testd. All of the above are correct.
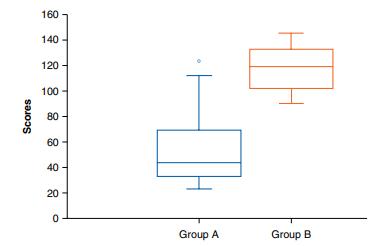
For the following boxplot image, data in which group likely contains an outlier?a. Group Ab. Group Bc. An outlier is not evident in either group. Scores 160 140 120- 100- 8 80 60 40 20 0 Group A Group B
A researchers evaluates the normality assumption and finds that skewness coefficient is+1.2 and the kurtosis coefficient is within +1.8 for the data measured. Did the researcher satisfy the normality assumption?a. No, because the kurtosis coefficient is not within ±1.0.b. No, because the skewness
Which of the following is a characteristic of nonparametric tests?a. They can be used even when we do not make inferences about parameters in a population.b. They generally do not require that the data in the population be normally distributed.c. They can be used to analyze data on a nominal or
______ are hypothesis tests used to test hypotheses about parameters in a population in which the data in the population are normally distributed and the data are measured on an interval or ratio scale of measurement. [Fill in the blank]a. Parametric testsb. Nonparametric tests
The power to detect an effect can affect the decisions we make using null hypothesis significance testing.a. Trueb. False
A researcher reports that the standard deviation in Population A is σ = 2.3 and the standard deviation in Population B is σ = 4.3. Which population is associated with the highest power to detect an effect?a. Population Ab. Population Bc. They are associated with the same level of power
If detecting an effect is associated with low power, what can the researcher do to increase power?a. Reduce the alpha level.b. Increase the sample size.c. Nothing; a researcher is powerless to increase power.
As effect size increases, what happens to the power?a. Power increases.b. Power decreases.c. Power does not change.
If the value stated by a null hypothesis is ______ the confidence interval, then the decision would likely be to reject the null hypothesis. [Fill in the blank]a. insideb. outside
A researcher estimates the 95% CI for scores in a sample with a mean of M = 1.5 and an standard error (σM) of 0.5. What is the confidence interval at this level of confidence?a. 95% CI 0.75, 2.25b. 95% CI 1.00, 2.00c. 95% CI 0.52, 2.48
Why is a point estimate typically reported with an interval estimate?a. Using only a point estimate is associated with low certainty.b. The interval estimate gives researchers a higher level of confidence.c. The interval estimate adds certainty to the estimate of the population mean.d. All of these
______ is a statistical procedure in which a sample statistic is used to estimate the value of an unknown population parameter. [Fill in the blank]a. Estimationb. Approximationc. Translation
Based on Cohen’s effect size conventions, d = 0.50 is aa. small effect sizeb. medium effect sizec. large effect size
A researcher selects a sample of 36 students and measures a sample mean of 27. For this example, what is the value of Cohen’s d?a. d = 0.20b. d = 0.50c. d = 1.00
The scores in a population are normally distributed with a mean of 24 and standard deviation of
Effect size is a measure that can describea. how far mean scores have shifted in the population.b. the percentage of variance that can be explained by a given variable.c. Both a and b are correct.
______ is a measure for the size of an effect in a population, whereas ______ is a statistic for deciding whether or not an effect exists in a population. [Fill in the blanks]a. Effect size; hypothesis testingb. Hypothesis testing; effect size
Which type of test is susceptible to the possibility of a Type III error?a. Directional (one-tailed) testb. Nondirectional (two-tailed) testc. Both a and b are correct.
A researcher conducts a hypothesis test and finds that p = .0289. What is the decision for a hypothesis test at a .05 level of significance?a. Fail to reject the null hypothesis.b. Reject the null hypothesis.c. It depends on whether the test is one-tailed or two-tailed
A researcher obtains z = 1.80 for a one-sample z test. What is the decision for this test at a .05 level of significance?a. Fail to reject the null hypothesis.b. Reject the null hypothesis.c. Reject the null hypothesis for a directional test; fail to reject the null hypothesis for a nondirectional
What type of hypothesis test is the following set of hypotheses appropriate for?H0: µ = 35 H1: µ ≠ 35a. A directional hypothesis test.b. A nondirectional hypothesis test.
The one-sample z test is a hypothesis test used to test hypothesesa. concerning a single population with a known variance.b. concerning at least one population.c. concerning the variance in a population.
The power of the decision-making process isa. stated by an alpha level.b. the same as a null finding.c. the likelihood of rejecting a false null hypothesis.
Suppose a researcher wants to make sure that the probability of committing a Type I error is not greater than 5%. How can the researcher control for this?a. Set the value for a Type II error at .05.b. Set the alpha level at .05.c. Place the rejection region in both tails.
In hypothesis testing, what type of error is associated with decisions to fail to reject the null hypothesis?a. Type I error.b. Type II error.
By stating a level of significance, what type of error do we directly control for in hypothesis testing?a. Type I error.b. Type II error.
What is the decision for a hypothesis test when we reach significance?a. Fail to reject the null hypothesis.b. Reject the null hypothesis.
The criteria for a decision regarding the value stated in a null hypothesis is set by thea. level of significance.b. p value.c. critical values.
In hypothesis testing, a researcher's decisiona. is based on a probability.b. depends on the level of significance for a hypothesis test.c. can be to reject or fail to reject the null hypothesis.d. All of these are correct.
The decision in hypothesis testing is to reject or fail to reject which hypothesis?a. The null hypothesis.b. The alternative hypothesis.
The first step to hypothesis testing requires that a researchera. state the hypotheses.b. make a decision.c. compute a test statistic.d. conduct a study.
The method of evaluating statistics in a sample to test hypotheses about parameters in a given population is calleda. order of operations.b. hypothesis generation.c. null hypothesis significance testing.
A researcher selects a sample of 81 participants from a population with a mean of 8 and a standard deviation of 9. About 14% of the sample means in this sampling distribution should be between a sample mean of: [Hint: Use the empirical rule to find the best answer]a. 6 and 8.b. 5 and 6.c. 9 and
A researcher selects a sample of 169 participants from a population with a mean of 38 and a standard deviation of 26. About 68% of the sample means in this sampling distribution should be between a sample mean of: [Hint: Use the empirical rule to find the best answer]a. 18 and 58.b. 34 and 38.c. 38
An article states that a sample of 40 participants took 12 ± 10 (M ± SEM) seconds to complete a cognitive assessment. Which value is the standard error of the mean?Answer: ____ [enter whole number]
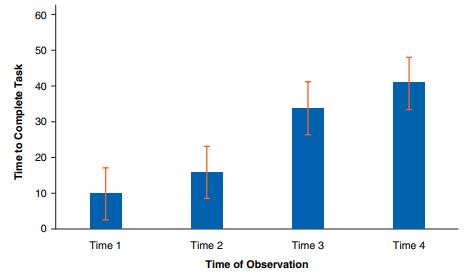
The image below used a bar chart to summarize the results of an assessment taken at four times. What feature in the figure summarizes the standard error or the mean for these data?a. The height of the rectangular bars in the figure.b. The distance between the rectangular bars in the figure.c. The
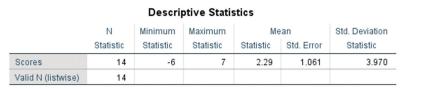
Identify the value of the standard error of the mean. [Give the value exactly as it is listed in the table] N Minimum Descriptive Statistics Maximum Mean Statistic Statistic Statistic Statistic Std. Error Scores 14 -6 7 2.29 1.061 Valid N (listwise) 14 Std. Deviation Statistic 3.970
Identify the value of the numerator for the standard error of the mean formula. [Give the value exactly as it is listed in the table] N Minimum Descriptive Statistics Maximum Mean Statistic Statistic Statistic Statistic Std. Error Scores 14 -6 7 2.29 1.061 Valid N (listwise) 14 Std. Deviation
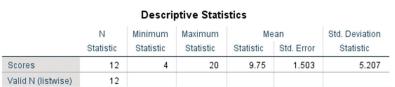
Identify the value of the numerator for the standard error of the mean formula. [Give the value exactly as it is listed in the table] Descriptive Statistics N Minimum Maximum Mean Statistic Statistic Statistic Statistic Std. Error Scores 12 4 20 9.75 1.503 Valid N (listwise) 12 Std. Deviation
Identify the value of the standard error of the mean. [Give the value exactly as it is listed in the table] Descriptive Statistics N Minimum Maximum Mean Statistic Statistic Statistic Statistic Std. Error Scores 12 4 20 9.75 1.503 Valid N (listwise) 12 Std. Deviation Statistic 5.207
The following samples were selected by two researchers. Which is associated with a smaller standard error of the mean?Researcher A: n = 100, = 10, σ = 16 Researcher B: n = 100, = 10, σ = 9a. Researcher A.b. Researcher B.c. Neither; both samples will be associated with the same value for standard
The following samples were selected by two researchers. Which is associated with a smaller standard error of the mean?Researcher A: n = 256, = 20, σ = 10 Researcher B: n = 200, = 20, σ = 10a. Researcher A.b. Researcher B.c. Neither; both samples will be associated with the same value for standard
Suppose the researcher obtains a sample of n = 100, yet after the data is collected, they find that 20 participants must be removed from the sample, leaving n = 80 as the final sample size. What will happen to the standard error as a result of reducing the sample size from 100 to 80 participants?a.
Suppose the researcher obtains two samples from this population. Sample 1 is n = 50 and Sample 2 is n = 100. Which sample will be associated with a smaller standard error?a. Sample 1.b. Sample 2.c. Neither; both samples will be associated with the same value for standard error.
Suppose Researcher A records data in a sample of 100 participants but Researcher B records data in a sample of 400 participants. Which researcher obtained a sample with the smaller standard error?a. Researcher A.b. Researcher B.c. Neither; both researchers obtained samples with the same value for
Suppose both researchers record data in a sample of 100 participants. Which researcher obtained a sample with the smaller standard error?a. Researcher A.b. Researcher B.c. Neither; both researchers obtained samples with the same value for standard error.
A researcher selects two samples of 25 participants each. In the first sample, the population mean was 32 and the variance was 16. In the second sample, the population mean was 4 and the standard deviation was 4. Which sample will be associated with a larger standard error of the mean?a. Sample
A researcher selects two samples of 64 participants each. In the first sample, the population mean was 10 and the variance was 16. In the second sample, the population mean was 25 and the variance was 9. Which sample will be associated with a larger standard error of the mean?a. Sample 1.b. Sample
Assuming n = 64, what is the likelihood of selecting a sample at random from this population with a sample mean equal to at least M = 15?Answer: ____ [enter number to ten thousandths place: .0000]
If a sample of 64 participants is selected from this population, what is the standard error of the mean (σM)?
Assuming a researcher increases the size of the sample from 36 to 50 participants, which of the following statements is true?a. It will be more likely to select a sample mean equal to M = 60 from a population with a mean of = 56.b. It will be less likely to select a sample mean equal to M = 60 from
Assuming n = 36, what is the likelihood of selecting a sample at random from this population with a sample mean equal to at least M = 60?
If a sample of 36 participants is selected from this population, what is the standard error of the mean (σM)?
What is the mean of the sampling distribution (M) for this population?
Showing 5300 - 5400
of 8686
First
47
48
49
50
51
52
53
54
55
56
57
58
59
60
61
Last
Step by Step Answers