New Semester Started
Get
50% OFF
Study Help!
--h --m --s
Claim Now
Question Answers
Textbooks
Find textbooks, questions and answers
Oops, something went wrong!
Change your search query and then try again
S
Books
FREE
Study Help
Expert Questions
Accounting
General Management
Mathematics
Finance
Organizational Behaviour
Law
Physics
Operating System
Management Leadership
Sociology
Programming
Marketing
Database
Computer Network
Economics
Textbooks Solutions
Accounting
Managerial Accounting
Management Leadership
Cost Accounting
Statistics
Business Law
Corporate Finance
Finance
Economics
Auditing
Tutors
Online Tutors
Find a Tutor
Hire a Tutor
Become a Tutor
AI Tutor
AI Study Planner
NEW
Sell Books
Search
Search
Sign In
Register
study help
business
probability statistics
Statistics For The Behavioral Sciences 4th Edition Gregory J Privitera - Solutions
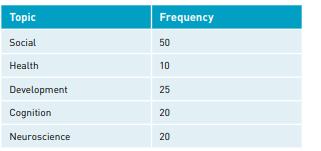
For which pairs of topics is the total probability of being chosen p = .32?a. Social and Health.b. Cognition and Neuroscience.c. Health and Development.d. Development and Cognition.
For these data, the probability is p = .08 that a student chooses which topic? [Hint: First convert this table to a relative frequency distribution]Answer: __ [enter S, H, D, C, or H]
For these data, the probability is p = .20 that a student chooses which topic? [Hint: First convert this table to a relative frequency distribution] Topic Social Health Frequency 60 50 10 10 Development 25 22 20 Cognition Neuroscience 20
Both probability and relative frequencya. vary between 0 and 1.b. can never be negative.c. Both a and b are correct.
The relative frequency of an event isa. the probability of its occurrence.b. the relative distance that scores fall from their mean.c. a frequency that totals the total number of scores in a distribution.
Three students in a class report on the probability of an outcome they observed. Morgan reports p = 2.00 of observing an outcome; Jorge reports p = 0.20 of observing an outcome;Paisley reports p = −0.02 of observing an outcome. Which student reported an appropriate probability?Answer: __ [enter
A researcher studying gambling behavior manipulates the odds of winning a game by creating three games: all three have one of 200 possible outcomes. Game A is set up so that 20 outcomes can result in winning; Game B is set up so that 60 outcomes can result in winning; Game C is set up so that 100
The probability of an outcome or event is particularly useful fora. measuring fixed events.b. predicting the likelihood of random events.c. identifying the variability of scores in a distribution.
The frequency of times an outcome occurs divided by the total number of possible outcomes, is calleda. probability.b. a random event.c. sample space.
What is the variance and standard deviation of a binomial distribution, given that n = 192, p = .09, and q = .91?a. σ2= 15.73; σ = 3.97b. σ2= 17.28; σ = 4.16c. σ2= 18.50; σ = 4.30
A local report indicates that the probability of a suburbanite committing a violent crime is .09. If the local suburb has 192 residents, about how many suburbanites can we expect to commit a violent crime?a. ~ 9 suburbanitesb. ~ 17 suburbanitesc. ~ 20 suburbanites
The distribution of probabilities for each outcome of a bivariate random variable is called aa. binomial distributionb. binomial probability distributionc. Both a and b are correct.
When is it sensible to use the computing formula to compute the variance and standard deviation of a probability distribution?a. When there is a large number of possible outcomes for a random variable.b. When there is a small number of possible outcomes for a random variable.
What are the mean and standard deviation of the following probability distribution?x 0 1 2 p(x) .35 .30 .35a. µ = 1.0; σ = 0.70b. µ = 1.0; σ = 0.84c. µ = 0.84; σ = 1.0d. µ = 0.70; σ = 1.0
There is a 75% chance that a store will earn a profit of $1,000 and a 25% chance it will lose $2,000 by marking all items half off. Using mathematical expectation, which of the following statements is true?a. We expect the store to earn a profit of $250 by marking all items half off.b. We expect
The probabilities are .12, .36, .32, and .20 that students will miss 0, 1, 2, and 3 questions, respectively, in an online assessment. How many questions should the researchers expect participants to miss on the test?a. 0.8b. 1.6c. 2.0
Which of the following explains why an expected value is also known as a “long-term mean”?a. To calculate an expected value, we assume that the random variable was observed an infinite number of times.b. To calculate an expected value, we assume that the random variable was observed a finite
The mean, or average expected outcome, of a given random variable is called a(n):a. expected valueb. mathematical expectationc. Both a and b are correct.
Which of the following probability distributions is correct?a. .35, −.10, .40, .25b. .15, .26, .54, .05c. .18, .32, .34, .36
The probabilities for all possible outcomes of a given random variable sum to what value?a. 0b. 1.0c. Any positive number.
The distribution of probabilities for each outcome of a random variable is called a(n):a. random distributionb. probability distributionc. independent distribution
An SPSS output table is given in the image below for the number of car buyers choosing to purchase a car with/without bucket seats and with/without a navigation system. [The table gives enough information for you to reproduce it in SPSS. Please feel free to enter these data in SPSS and follow the
The same options in the menu bar are used to construct a probability table and construct a conditional probability table in SPSS.a. Trueb. False
Using SPSS, which options in the menu bar do you select to construct a probability table?a. Analyze, then Descriptive Statistics and Explore.b. Analyze, then Descriptive Statistics and Crosstabs.c. Analyze, then Descriptive Statistics and Frequencies.
The probability that a participant is married is p(M) = .60. The probability that a participant is “in love” is p(L) = .22. The probability that a participant is married and “in love” is p(M|L) = .45. Assuming that these are random events, use Bayes’s theorem to identify which of the
Bayes’s theorem can be applied to situations where we want to determine the conditional probability of obtaining samples of data, given that a parameter in some population is known.a. Trueb. False
What theorem is a mathematical formula that relates the conditional and marginal (unconditional) probabilities of two conditional outcomes that occur at random?a. Relational theoremb. Bayes’s theoremc. Independent theorem
In the following table for the body type and type of exercise training among a sample of athletes, what is the conditional probability (p) of an athlete being muscular, given that they engage in strength training?a. P(M|S) = 25/160 = .16.b. p(M|S) = 25/80 = .31c. p(M|S) = 25/73 =.34d. p(M|S) =
Identify which of the following is an example of complementary outcomes.a. Winning and losing (assuming no ties) a game.b. Rolling a 3 or a 4 using one roll of a fair 6-sided die.
Two outcomes (A and B) are independent, where p(A) = .45 and p(B) is .28. What is the probability of A and B?a. p = .45 + .28 = .73b. p = .45 - .28 = .17c. p = .45 × .28 = .13
What rule states that the product of the individual probabilities for two independent outcomes is equal to the probability that both outcomes occur?a. The additive rule.b. The multiplicative rule.
Two outcomes (A and B) are mutually exclusive, where p(A) = .45 and p(B) is .28. What is the probability of A and B?a. 0b. .28c. .45d. .73
Two outcomes are mutually exclusive whena. the two outcomes can occur together.b. the two outcomes cannot occur together.
If the relative frequency of an outcome is .90, then what is the probability of this outcome?.a. p = .10b. p = .90c. Not enough information
At right is the relative frequency distribution for whether an employee comes to work on time at a local business. What is the probability that an employee comes in late to work?On Time? Relative Frequency Yes .82 No .18a. p = .18b. p =.82c. p = 1.00
The probability of an outcome is the same as the relative frequency of its occurrence.a. Trueb. False
Identify which of the following is an appropriate probability statement.a. p = 88b. p = −.26c. p = 1.45d. p = .05
A researcher has participants complete a computer task in which they can choose to play one of 200 games. Of the 200 games, only 80 are set up so that participants can win the game. What is the probability that a participant will choose a game that they can win?a. p = .40b. p = .50c. p = .80
A researcher evaluates the probability that gaming (the event) can enhance mental health (the outcome). What type of event is gaming?a. fixed eventb. random event
A probability ranges between what values?a. −1.0 and +1.0b. 0 and 1.0c. Any positive value
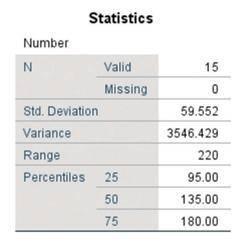
An SPSS output is given below for the number of patrons visiting each of 15 exhibits at an art museum. Th e number of patrons visiting each exhibit was 230, 180, 95, 100, 30, 110, 105, 145, 90, 135, 95, 200, 250, 180, and 155 patrons. [Please feel free to enter these data in SPSS and follow the
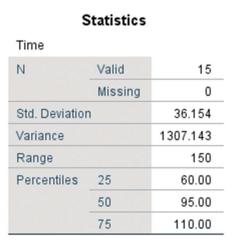
An SPSS output is given below for the time spent (in seconds) at each of 15 exhibits at an art museum. Th e time spent at each exhibit was 60, 80, 95, 120, 115, 110, 60, 30, 80, 50, 65, 100, 180, 105, and 100 seconds. [Please feel free to enter these data in SPSS and follow the directions given in
A researcher measures the amount of coff ee consumed by college students while studying during the fi nal exam week. Th ey fi nd that students drink 2.3 ± 0.8 (M ± SD) cups of coff ee per study session. Assuming the data are normally distributed, which of the following is the most appropriate
A school administrator had students rate the quality of their education on a scale from 1 (poor) to 7 (exceptional). Th ey identifi ed that 99.7% of students rated the quality of their education between 3.5 and 6.5. If the mean rating is 5.0, then what is the standard deviation, assuming the data
An analyst records the number of goals scored in a random sample of 81 soccer matches during a season. If the standard deviation of goals scored was 3, then what was the value for SS in this sample data set?Answer: __ [enter whole number]
A student records a population of scores on an assessment as part of a project for class. If the student compute SS = 240 and computes a standard deviation of 3, then how many scores were measured in this population?Answer: __ [enter whole number]
A researcher computes a standard deviation of 12. Will the variance differ if 12 is the value for the population standard deviation and the sample standard deviation?a. No, in both cases, the variance is 12.b. No, in both cases, the variance is the standard deviation, squared.c. Yes, the sample
A researcher computes a variance of 9. Will the standard deviation differ if 9 is the value for the population variance and the sample variance?a. No, in both cases, the standard deviation is 9.b. No, in both cases, the standard deviation is the square root of the variance.c. Yes, the sample
How is the sample variance computed differently from the population variance?a. Only one formula includes a computation for SS.b. The calculation in the numerator is different.c. The calculation in the denominator is different.d. None of these; the sample variance and population variance are
The sample variance is a(n) ____ of the population variance when we divide the SS by ____. [Fill in the blanks]a. unbiased estimator; degrees of freedomb. unbiased estimator; n – 1c. biased estimator; nd. All of these are correct.
Each deviation in the numerator for variance is squared becausea. without squaring each deviation, the solution for SS would be zero.b. this inflates the value for variance, making it more accurate.c. without squaring each deviation, the solution could be negative.
Which of the following describes the definitional formula for variance?a. It is stated in terms of how variance is defined.b. The mean must be computed to compute SS in the variance formula.c. Both a and b are correct.
A researcher records scores on a standardized assessment in a nationwide sample of 1,201 participants. If the sample variance for these data is equal to 9, then what is the value of the SS for these data?Answer: __ [enter whole number; do not use commas]
A behavioral scientist measures attention in a sample of patients recently experiencing trauma. In the measure for the variance of attention, they compute SS = 1,200 in this sample. If the sample variance for these data is equal to 48, then how many patients were observed in this study?Answer: __
The sample variance is computed by dividing SS by ____, whereas the population variance is computed by dividing SS by ____. [Fill in the blanks]a. N; dfb. df; n – 1c. df; Nd. n – 1; df
All other things being equal (so assuming that the value of SS never changes), as sample size increases,a. the degrees of freedom for sample variance decrease.b. the value of the degrees of freedom for sample variance also increases.c. the value in the numerator for sample variance increases.d. the
What is the value of the sum of squares for these data?Answer: __ [enter whole number; do not use commas]
Which of the following statements regarding the sum of squares (SS) for these data is true?a. SS will be larger for the sample variance compared to the population variance.b. SS will be larger for the population variance compared to the sample variance.c. SS will be the same value for the sample
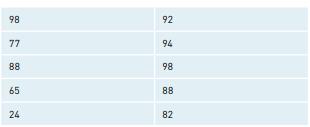
What is the SIQR of data in this population? 98 92 77 94 88 98 65 88 24 82
What is the IQR of data in this population? 98 92 77 94 88 98 65 88 24 82
Which of the following is a limitation for using the range to describe variability?a. The range only accounts for two scores in its calculation.b. The range is less informative when a data set includes outliers.c. Both a and b are correct.
A researcher collects the following scores: 2, 2, 3, 3, 5, 5, 6, and 25. Is the range an informative measure for these data?a. Yes, the range would be 25 – 2 = 23.b. No, the data does not have enough values to compute the range.c. No, the data set has an outlier which makes the range less
A researcher collects the following scores: −2, 2, 3, 3, 5, 6, 7, and 10. What is the range of these scores?Answer: __ [enter whole number]
The range includes ____values in its calculation. [Fill in the blank]:Answer: __ [enter whole number]
A researcher records the following scores: −2, −2, −2, −2, and −2. What is the variability of these scores?Answer: __ [enter whole number]
A researcher records the following scores: 3, 3, 3, 3, and 3. What is the variability of these scores?Answer: __ [enter whole number]
A negative variability isa. meaninglessb. informativec. very common
What measures are used to locate a single score used to determine the dispersion or spread of scores in a distribution?a. meanb. variabilityc. central tendency
A portion of an SPSS output table is given in the image below for the following data for the reaction time (in seconds) to a prompt or cue among 20 participants: 2, 3, 3, 4, 4, 4, 5, 5, 5, 5, 5, 6, 6, 6, 7, 8, 9, 9, 10, and 12. [Please feel free to enter these data in SPSS and follow the directions
Options to compute the range, quartiles, variance, and standard deviation are all located in the same dialog box.a. Trueb. False
Using SPSS, which options in the menu bar do you select to compute the range, the variance, and the standard deviation?a. Analyze, then Descriptive Statistics and Exploreb. Analyze, then Descriptive Statistics and Descriptivesc. Analyze, then Descriptive Statistics and Frequencies
An instructor measures the following quiz scores: 6, 8, 7, and 9 (SD = 1.29). If the instructor subtracts 2 points from each quiz score, how will the value for the standard deviation change?a. The standard deviation will increase.b. The standard deviation will decrease.c. The standard deviation
Which of the following is a characteristic of the standard deviation?a. The standard deviation is always positive.b. The standard deviation is affected by the value of every score in a distribution.c. The standard deviation is almost always reported with the mean.d. All of the above.
How many standard deviations from the mean will contain approximately 99% of data for any type of distribution? Hint: Refer to the MAKING SENSE section on standard deviation and nonnormal distributions earlier in this chapter.a. 1 standard deviationb. 3 standard deviationsc. 10 standard deviations
The empirical rule applies for data sets with what type of distribution?a. skewed distributionb. normal distributionc. multimodal distribution
If the variance is 121, then what is the standard deviation?a. 10b. 11c. 12
Researcher A computes a sample variance of 150. Researcher B computes a population variance of 120. Which researcher will compute a larger value for standard deviation?a. Researcher Ab. Researcher B
The square root of the variance is calleda. rangeb. variancec. standard deviation
A researcher records five scores: 3, 4, 5, 6, and x. If the mean in this distribution is 5, then what is the value for x?a. 5b. 6c. 7
The sample variance is ______ when dividing SS by (n − 1). [Fill in the blank]a. biasedb. unbiased
How many scores are free to vary in a sample?a. 1b. n scoresc. (n – 1) scores
Using the definitional formula for variance, why do we square each deviation before summing in the numerator of the formula?a. If we did not square deviations, then the solution would always be 0 when we sum the deviations.b. The sum of the squared differences of scores from their mean is
A researcher records the following five scores: 1, 4, 5, 6, and 7. Which formula will produce the larger value for SS?a. The definitional formula for variance.b. The computational formula for variance.c. Neither; the value for SS using the definitional and computational formulas for variance will
With identical data sets, the definitional and computational formula for variance will always produce the same solution, give or take rounding error.a. Trueb. False
How is the computational formula for variance different from the definitional formula for variance?a. The computational formula can only be used to compute SS for a population.b. The computational formula can only be used to compute SS for a sample.c. The computational formula does not require that
A researcher measures SS = 90 among 10 participants and records a variance equal to 10. Which of the following correctly identifies the type of variance computed?a. The sample variance because the researcher divided by N to compute variance.b. The population variance because the researcher divided
When all scores in a population are the same, the variance will always be equal to 0.a. Trueb. False
A researcher measures the following scores: 12, 14, 16, 18, and 20. What is the value of SS for these data?a. 8b. 16c. 40
A researcher selects a population of eight scores where SS = 72. What is the value for population variance in this example?a. 8b. 9c. 10.29
Which of the following explains why the variance is a preferred measure of variability?a. Compared to measures of range, the variance includes all scores in its computation.b. Compared to measures of range, the variance only includes the largest scores in its computation.
A researcher records the number of times that 10 students cough during a final exam.They record the following data: 0, 0, 0, 3, 3, 5, 5, 7, 8, and 11. In this example, the range will be smaller than the interquartile range (IQR).a. True, the range will be smaller than the IQR.b. False, the range
When data are divided into four equal parts, the data are split into ________. [Fill in the blank]a. medianb. quartilesc. percentiles
______ are measures used to divide data into two or more parts. [Fill in the blank]a. Fractilesb. Boundariesc. Measures of central tendency
A researcher collects the following scores: 1, 2, 3, 4, 5, 6, 7, and 8. What is the range of these scores?a. 8 + 1 = 9b. 8 – 1 = 7c. 8, because it is the largest value in the data set.
The range accounts for ____values in a distribution. [Fill in the blank]a. 0b. 2c. 2 or more
The range is measured as the ____ value minus the ____ value. [Fill in the blanks]a. largest; smallestb. positive; negativec. known; unknown
Why are calculations for measures of variability in a sample and a population given unique notation?a. Because samples and populations are similar in terms of their size and therefore are given unique notation.b. Because samples are distinct from populations and therefore are given unique notation
A researcher recorded the following scores: 2.3, 2.3, 2.3, 2.3, and 2.3. What is the variability of these scores?a. 0b. 2.3c. Cannot be determined.
Variability ranges froma. 0 to 1.0b. −∞ to +∞c. 0 to +∞
Measures of variability are statistical measures for locating a single score used to determine the ____ of scores in a distribution [Fill in the blank]a. centerb. dispersionc. frequency
Showing 5800 - 5900
of 8686
First
52
53
54
55
56
57
58
59
60
61
62
63
64
65
66
Last
Step by Step Answers