New Semester
Started
Get
50% OFF
Study Help!
--h --m --s
Claim Now
Question Answers
Textbooks
Find textbooks, questions and answers
Oops, something went wrong!
Change your search query and then try again
S
Books
FREE
Study Help
Expert Questions
Accounting
General Management
Mathematics
Finance
Organizational Behaviour
Law
Physics
Operating System
Management Leadership
Sociology
Programming
Marketing
Database
Computer Network
Economics
Textbooks Solutions
Accounting
Managerial Accounting
Management Leadership
Cost Accounting
Statistics
Business Law
Corporate Finance
Finance
Economics
Auditing
Tutors
Online Tutors
Find a Tutor
Hire a Tutor
Become a Tutor
AI Tutor
AI Study Planner
NEW
Sell Books
Search
Search
Sign In
Register
study help
business
production and operations management
Operations Management: Sustainability And Supply Chain Management 13th Edition Jay Heizer; Barry Render; Chuck Munson - Solutions
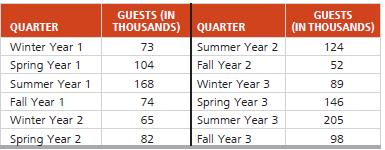
4.27 Attendance at Orlando’s newest Disneylike attraction, Lego World, has been as follows:Compute seasonal indices using all of the data. QUARTER GUESTS (IN THOUSANDS) QUARTER GUESTS (IN THOUSANDS) Winter Year 1 73 Summer Year 2 124 Spring Year 1 104 Fall Year 2 52 Summer Year 1 168 Winter Year
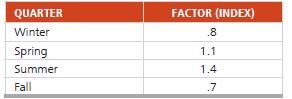
• 4.28 North Dakota Electric Company estimates its demand trend line (in millions of kilowatt hours) to be:D = 77 + 0.43Q where Q refers to the sequential quarter number and Q 5 1 for winter of Year 1. In addition, the multiplicative seasonal factors are as followsForecast energy use for the four
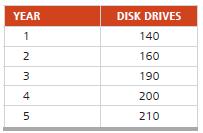
• 4.29 The number of disk drives (in millions) made at a plant in Taiwan during the past 5 years follows:a) Forecast the number of disk drives to be made next year, using linear regression.b) Compute the mean squared error (MSE) when using linear regression.c) Compute the mean absolute percent
• • • 4.32 Using the 911 call data in Problem 4.31, forecast calls for weeks 2 through 25 with a trend-adjusted exponential smoothing model. Assume an initial forecast for 50 calls for week 1 and an initial trend of zero. Use smoothing constants of a = .3 and b = .2. Is this model better than
• 4.36 Given the following data, use exponential smoothing(a = 0.2) to develop a demand forecast. Assume the forecast for the initial period is 5 PERIOD 1 2 3 4 5 6 DEMAND 7 9 5 9 13 8
• 4.37 Calculate (a) MAD and (b) MSE for the following forecast versus actual sales figures: FORECAST 100 110 120 130 ACTUAL 95 108 123 130
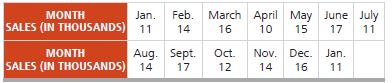
• • • 4.38 Sales of industrial vacuum cleaners at Larry Armstrong Supply Co. over the past 13 months are shown below:a) Using a moving average with three periods, determine the demand for vacuum cleaners for next February.b) Using a weighted moving average with three periods, determine the
• 4.39 Given the following data, use least-squares regression to derive a trend equation. What is your estimate of the demand in period 7? In period 12? PERIOD 1 2 3 4 5 6 DEMAND 7 9 5 11 10 13
• 4.44 Lori Cook has developed the following forecasting model:ny = 36 + 4.3x where ny = demand for Kool Air conditioners and x 5 the outside temperature (°F)a) Forecast demand for the Kool Air when the temperature is 70° F.b) What is demand when the temperature is 80° F?c) What is demand when
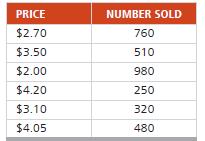
• • 4.45 Café Michigan’s manager, Gary Stark, suspects that demand for mocha latte coffees depends on the price being charged. Based on historical observations, Gary has gathered the following data, which show the numbers of these coffees sold over six different price values:Using these
• • 4.51 Using the data in Problem 4.30, apply linear regression to study the relationship between the robbery rate and Dr. Fok’s patient load. If the robbery rate increases to 131.2 in year 11, how many phobic patients will Dr. Fok treat? If the robbery rate drops to 90.6, what is the
• • 4.53 Using the date in Problem 4.47, the company wants to find out how closely sales are related to the money spent on advertisements.a) Calculate the coefficient of correlation for the data given in Problem 4.47 and comment on the degree of the linear relationship.b) If the correlation
• 4.55 The following multiple regression model was developed to predict job performance as measured by a company job performance evaluation index based on a preemployment test score and college grade point average (GPA):yn = 35 + 20x1 + 50x2 Where yn = job performance evaluation index x1 =
• • 4.56 A study to determine the correlation between bank deposits and consumer price indices in Birmingham, Alabama, revealed the following (which was based on n = 5 years of data):• Σx = 15• Σx2 = 55• Σxy = 70• Σy = 20• Σy2 = 130a) What is the equation of the least-squares
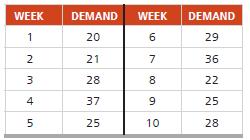
• • 4.59 Sales of tablet computers at Ted Glickman’s electronics store in Washington, D.C., over the past 10 weeks are shown in the table below:a) Forecast demand for each week, including week 10, using exponential smoothing with a 5 .5 (initial forecast 5 20).b) Compute the MAD.c) Compute
• • 4.61 Passenger miles flown on Northeast Airlines, a commuter firm serving the Boston hub, are shown for the past 12 weeks:a) Assuming an initial forecast for week 1 of 17,000 miles, use exponential smoothing to compute miles for weeks 2 through 12. Use a = .2b) What is the MAD for this
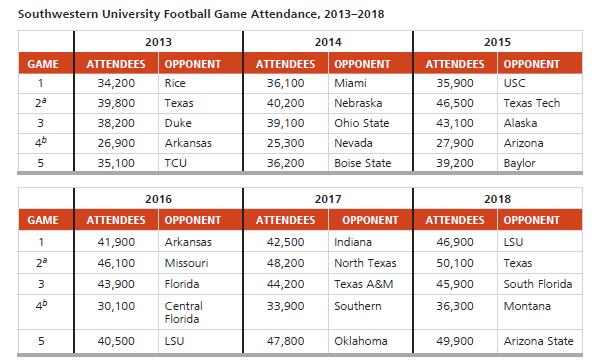
1. Develop a forecasting model, justifying its selection over other techniques, and project attendance through 2020.Southwestern University (SWU), a large state college in Stephenville, Texas, enrolls close to 20,000 students. The school is a dominant force in the small city, with more students
2. What revenues are to be expected in 2019 and 2020?Southwestern University (SWU), a large state college in Stephenville, Texas, enrolls close to 20,000 students. The school is a dominant force in the small city, with more students during fall and spring than permanent residents.Always a football
3. Discuss the school’s options.Southwestern University (SWU), a large state college in Stephenville, Texas, enrolls close to 20,000 students. The school is a dominant force in the small city, with more students during fall and spring than permanent residents.Always a football powerhouse, SWU is
1. Use the data in Table 4.3 to build a regression model with day of the week as the only independent variable.For its first two decades of existence, the NBA’s Orlando Magic basketball team set seat prices for its 41-game home schedule the same for each game. If a lower-deck seat sold for $150,
2. Use the data to build a model with rating of the opponent as the sole independent variable.For its first two decades of existence, the NBA’s Orlando Magic basketball team set seat prices for its 41-game home schedule the same for each game. If a lower-deck seat sold for $150, that was the
3. Using Perez’s multiple regression model, what would be the additional sales potential of a Thursday Miami Heat game played during the Christmas holiday?For its first two decades of existence, the NBA’s Orlando Magic basketball team set seat prices for its 41-game home schedule the same for
4. What additional independent variables might you suggest to include in Perez’s model?For its first two decades of existence, the NBA’s Orlando Magic basketball team set seat prices for its 41-game home schedule the same for each game. If a lower-deck seat sold for $150, that was the price
1. Describe three different forecasting applications at Hard Rock.Name three other areas in which you think Hard Rock could use forecasting models.With the growth of Hard Rock Cafe—from one pub in London in 1971 to more than 163 restaurants in 68 countries today—came a corporatewide demand for
2. What is the role of the POS system in forecasting at Hard Rock?With the growth of Hard Rock Cafe—from one pub in London in 1971 to more than 163 restaurants in 68 countries today—came a corporatewide demand for better forecasting. Hard Rock uses long-range forecasting in setting a capacity
3. Justify the use of the weighting system used for evaluating managers for annual bonuses.With the growth of Hard Rock Cafe—from one pub in London in 1971 to more than 163 restaurants in 68 countries today—came a corporatewide demand for better forecasting. Hard Rock uses long-range
4. Name several variables besides those mentioned in the case that could be used as good predictors of daily sales in each cafe.With the growth of Hard Rock Cafe—from one pub in London in 1971 to more than 163 restaurants in 68 countries today—came a corporatewide demand for better forecasting.
5. At Hard Rock’s Moscow restaurant, the manager is trying to evaluate how a new advertising campaign affects guest counts.Using data for the past 10 months (see the table), develop a least-squares regression relationship and then forecast the expected guest count when advertising is $65,000.With
Forecasting time horizons include:a) long range.b) medium range.c) short range.d) all of the choices.
LO 4.2 Qualitative methods of forecasting include:a) sales force composite.b) jury of executive opinion.c) consumer market survey.d) exponential smoothing.e) all except (d).
LO 4.3 The difference between a moving-average model and an exponential smoothing model is that .
LO 4.5 Average demand for iPods in the Apple store in Rome, Italy, is 800 units per month. The May monthly index is 1.25. What is the seasonally adjusted sales forecast for May?a) 640 unitsb) 798.75 unitsc) 800 unitsd) 1,000 unitse) cannot be calculated with the information given
LO 4.6 The main difference between simple and multiple regression is _________ .
LO 4.7 The tracking signal is the:a) standard error of the estimate.b) cumulative error.c) mean absolute deviation (MAD).d) ratio of the cumulative error to MAD.e) mean absolute percent error (MAPE).
LO 5.2 Describe a product development system
LO 5.4 Explain how time-based competition is implemented by OM
LO 5.5 Describe how goods and services are defined by OM
LO 5.6 Describe the documents needed for production
Great Cameras, Inc., wants a methodology that strengthens its ability to meet customer desires with its new digital camera.APPROACH c Use QFD’s house of quality
First Bank Corp. wants to ensure effective delivery of service to its drive-up customers.APPROACH c Develop a “production” document for the tellers at the drive-up window that provides the information necessary to do an effective job.
Silicon, Inc., a semiconductor manufacturer, is investigating the possibility of producing and marketing a microprocessor. Undertaking this project will require either purchasing a sophisticated CAD system or hiring and training several additional engineers. The market for the product could be
1. Why is it necessary to document a product explicitly?
2. What techniques do we use to define a product?
5. What is concurrent engineering and why is it adopted by companies?
8. Explain what is meant by robust design.
11. What information is contained in an engineering drawing?
12. How can the voice of the customer be incorporated in the design of products and services?
13. Explain what is meant in service design by the “moment of truth.”
14. Explain how the house of quality translates customer desires into product/service attributes.
15. Discuss the advantages and disadvantages of involving customers fairly early in the product design process.
16. Describe several applications of virtual reality in product design.
17. What is the difference between virtual reality and augmented reality?
18. Identify three products or services that employ:a) Interchangeabilityb) Standardizationc) Modular design
Sarah King, president of King Electronics, Inc., has two design options for her new line of high-resolution monitors for CAD workstations. The life cycle for this model is 100,000 units.Design option A has a .90 probability of yielding 60 good monitors per 100 and a .10 probability of yielding 65
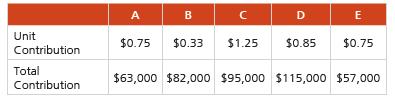
• 5.3 Perform a “product-by-value” analysis on products A, B, C, D, and E. A B C D E Unit $0.75 $0.33 $1.25 $0.85 $0.75 Contribution Total $63,000 $82,000 $95,000 $115,000 $57,000 Contribution
• • 5.6 Prepare a house of quality for a mousetrap.
• • • • 5.8 Using the house of quality sequence, as described in Figure 5.4 on page 201, determine how you might deploy resources to achieve the desired quality for a product or service whose production process you understand.
• • 5.10 Draw an assembly chart for a pair of eyeglasses and its case.
• • 5.11 Prepare a script for telephone callers at the university’s annual “phone-a-thon” fundraiser.
• • 5.13 Prepare a bill of material and an assembly chart for a salad of your own choosing.
• • 5.14 Prepare a bill of material for a wooden pencil, complete with eraser.
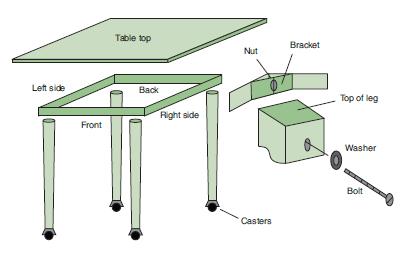
• • 5.15 Prepare a bill of material for the table illustrated: Left side Front Table top Back Right side Nut Casters Bracket Top of leg Washer Bolt
• • 5.16 Prepare a bill of material for a computer mouse(GeniMouse).
• • 5.17 Prepare a bill of material for a mechanical pencil.
• • • 5.23 Use the data in Solved Problem 5.1 to examine what happens to the decision if Sarah King can increase all of Design B yields from 59,000 to 64,000 by applying an expensive phosphorus to the screen at an added manufacturing cost of $250,000. Prepare the modified decision tree. What
• • 5.25 A company has developed a promising new product and examines the following three alternatives of manufacturing.Alternative 1 is to buy a semiautomatic machine with an initial cost of €130,000. Alternative 2 is to buy a fully automatic machine with an initial cost of €180,000.
1. What drives McDonald’s need for creating local products in addition to their traditional menu items? In the fast food industry, standardization has always been a key to success—products that taste and look the same, no matter which location you visit, builds recognition and brand loyalty.But
2. How can phasing out traditional menu items in some markets be a successful strategy? In the fast food industry, standardization has always been a key to success—products that taste and look the same, no matter which location you visit, builds recognition and brand loyalty.But when a brand
3. Which other industries need localized products despite standardization being an important factor? In the fast food industry, standardization has always been a key to success—products that taste and look the same, no matter which location you visit, builds recognition and brand loyalty.But when
1. How does the concept of product life cycle apply to Regal Marine products? With hundreds of competitors in the boat business, Regal Marine must work to differentiate itself from the flock. As we saw in the Global Company Profile that opened this chapter, Regal continuously introduces innovative,
2. What strategy does Regal use to stay competitive? With hundreds of competitors in the boat business, Regal Marine must work to differentiate itself from the flock. As we saw in the Global Company Profile that opened this chapter, Regal continuously introduces innovative, high-quality new boats.
3. What kind of engineering savings is Regal achieving by using CAD technology rather than traditional drafting techniques? With hundreds of competitors in the boat business, Regal Marine must work to differentiate itself from the flock. As we saw in the Global Company Profile that opened this
4. What are the likely benefits of the CAD design technology? With hundreds of competitors in the boat business, Regal Marine must work to differentiate itself from the flock. As we saw in the Global Company Profile that opened this chapter, Regal continuously introduces innovative, high-quality
1. Identify the product design options that Celebrity Cruises has available as it designs a new ship. Cruising is a growth industry, expanding by 6% to 7% annually for the past 30 years. Recognizing this growth opportunity, Celebrity Cruises, Inc., has enlarged its offerings in the
2. How does Celebrity’s product strategy differ from the strategy of its sister companies, Royal Caribbean Cruises Ltd. and Azamara Club Cruises? Cruising is a growth industry, expanding by 6% to 7% annually for the past 30 years. Recognizing this growth opportunity, Celebrity Cruises, Inc., has
3. How might Figure 5.3 be modified to reflect the product development cycle at Celebrity Cruises? Cruising is a growth industry, expanding by 6% to 7% annually for the past 30 years. Recognizing this growth opportunity, Celebrity Cruises, Inc., has enlarged its offerings in the premium“upscale
4. How does Celebrity’s product development process compare with the product development organizations suggested in your text? Cruising is a growth industry, expanding by 6% to 7% annually for the past 30 years. Recognizing this growth opportunity, Celebrity Cruises, Inc., has enlarged its
LO 5.1 A product’s life cycle is divided into four stages, including:a) introduction.b) growth.c) maturity.d) all of the above.
LO 5.2 Product development systems include:a) bills of material.b) routing charts.c) functional specifications.d) product-by-values analysis.e) configuration management.
LO 5.3 A house of quality is:a) a matrix relating customer “wants” to the firm’s “hows.”b) a schematic showing how a product is put together.c) a list of the operations necessary to produce a component.d) an instruction to make a given quantity of a particular item.e) a set of detailed
LO 5.4 Time-based competition focuses on:a) moving new products to market more quickly.b) reducing the life cycle of a product.c) linking QFD to PLM.d) design database availability.e) value engineering.
LO 5.5 Products are defined by:a) value analysis.b) value engineering.c) routing sheets.d) assembly charts.e) engineering drawings.
LO 5.6 A route sheet:a) lists the operations necessary to produce a component.b) is an instruction to make a given quantity of a particular item.c) is a schematic showing how a product is assembled.d) is a document showing the flow of product components.e) all of the above.
LO 5.7 Decision trees use:a) probabilities.b) payoffs.c) logic.d) options.e) all of the above.
Milwaukee Paper Manufacturing had long delayed the expense of installing advanced computerized air pollution control equipment in its facility. But when the board of directors adopted a new proactive policy on sustainability, it did not just authorize the budget for the state-of-the-art equipment.
Draw the AON network for Milwaukee Paper, using the data in Example 1.APPROACH c In the AON approach, we denote each activity by a node. The lines, or arrows, represent the precedence relationships between the activities.
Draw the complete AOA project network for Milwaukee Paper’s problem.APPROACH c Using the data from Table 3.1 in Example 1, draw one activity at a time, starting with A.
Calculate the earliest start and finish times for the activities in the Milwaukee Paper Manufacturing project.APPROACH c Use Table 3.2, which contains the activity times. Complete the project network for the company’s project, along with the ES and EF values for all activities.
Calculate the latest start and finish times for each activity in Milwaukee Paper’s pollution project.APPROACH c Use Figure 3.10 as a beginning point. Overlay 1 of Figure 3.10 shows the complete project network for Milwaukee Paper, along with added LS and LF values for all activities. In what
Calculate the slack for the activities in the Milwaukee Paper project.APPROACH c Start with the data in Overlay 1 of Figure 3.10 in Example 5 and develop Table 3.3 one line at a time.
Show Milwaukee Paper’s critical path and find the project completion time.APPROACH c We use Table 3.3 and Overlay 3 of Figure 3.10. Overlay 3 of Figure 3.10 indicates that the total project completion time of 15 weeks corresponds to the longest path in the network. That path is Start-A-C-E-G-H in
Julie Ann Williams and the project management team at Milwaukee Paper want an expected time and variance for Activity F (Installing the Pollution Control System) where:a = 1 week, m = 2 weeks, b = 9 weeks APPROACH c Use Equations (3–6) and (3–7) to compute the expected time and variance for F.
Milwaukee Paper’s managers now wish to know the project’s variance and standard deviation.APPROACH c Because the activities are independent, we can add the variances of the activities on the critical path and then take the square root to determine the project’s standard deviation
Julie Ann Williams would like to find the probability that her project will be finished on or before the 16-week Earth Day deadline.APPROACH c To do so, she needs to determine the appropriate area under the normal curve. This is the area to the left of the 16th week.
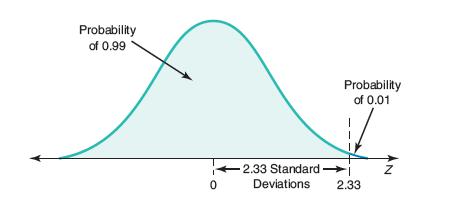
Julie Ann Williams wants to find the due date that gives her company’s project a 99% chance of on-time completion.APPROACH c She first needs to compute the Z-value corresponding to 99%, as shown in Figure 3.14.Mathematically, this is similar to Example 10, except the unknown is now the due date
Suppose the plant manager at Milwaukee Paper Manufacturing has been given only 13 weeks (instead of 16 weeks) to install the new pollution control equipment. As you recall, the length of Julie Ann Williams’s critical path was 15 weeks, but she must now complete the project in 13 weeks.APPROACH c
2. Explain the purpose of project organization.
6. What is the use of Gantt charts in project management?
10. Describe how expected activity times and variances can be computed in a PERT network.
11. Define earliest start, earliest finish, latest finish, and latest start times.
Showing 2300 - 2400
of 5227
First
17
18
19
20
21
22
23
24
25
26
27
28
29
30
31
Last
Step by Step Answers