New Semester
Started
Get
50% OFF
Study Help!
--h --m --s
Claim Now
Question Answers
Textbooks
Find textbooks, questions and answers
Oops, something went wrong!
Change your search query and then try again
S
Books
FREE
Study Help
Expert Questions
Accounting
General Management
Mathematics
Finance
Organizational Behaviour
Law
Physics
Operating System
Management Leadership
Sociology
Programming
Marketing
Database
Computer Network
Economics
Textbooks Solutions
Accounting
Managerial Accounting
Management Leadership
Cost Accounting
Statistics
Business Law
Corporate Finance
Finance
Economics
Auditing
Tutors
Online Tutors
Find a Tutor
Hire a Tutor
Become a Tutor
AI Tutor
AI Study Planner
NEW
Sell Books
Search
Search
Sign In
Register
study help
business
statistics principles and methods
Fundamental Statistics For The Behavioral Sciences 7th Edition David C Howell - Solutions
Use protected tests for the data in Exercise 16.7 to clarify the meaning of the significant
Calculate and for the data in Exercise 16.7, and interpret their meaning.
Foa, Rothbaum, Riggs, and Murdock (1991) conducted a study evaluating four different types of therapy for rape victims. The Stress Inoculation Therapy (SIT) group received instructions on coping with stress. The Prolonged Exposure (PE) group went over the events in their minds repeatedly. The
Calculate and for the data in Exercise 16.2.
Another way to look at the Eysenck study mentioned in Exercise 16.1 is to compare four groups of participants. One group consisted of Younger participants who were presented the words to be recalled in a condition that elicited a Low level of processing. A second group consisted of Younger
We began the chapter with a study by Eysenck (1974) in which he compared the recall of older participants under one of 5 levels of processing. Another aspect of Eysenck’s study compared Younger and Older participants on their ability to recall material in the face of instructions telling that
Joshua Aronson has spent considerable time studying “stereotype threat,” which refers to the fact that “members of stereotyped groups often feel extra pressure in situations where their behavior can confirm the negative reputation that their group lacks a valued ability.”(Aronson, Lustina,
Why would we ever want to calculate power after an experiment has been run, as we just did in Exercises 15.22 and 15.23?
Calculate the power of the comparison of TATs from the parents of schizophrenic and normal subjects in Exercise 14.8.
If and we are testing what value of the mean under would result in power being equal to the probability of a Type II error?(Hint: This is most easily solved by sketching the two distributions. Which areas are you trying to equate?)
Assume we want to test a null hypothesis about a single mean at one-tailed.Further assume that all necessary assumptions are met. Is there ever a case in which we are more likely to reject a true than we are to reject if it is false? (In other words, can power ever be less than ?)
Generate a table analogous to Table 15.3 for power equal to 0.80, with two-tailed.
Diagram the answer to Exercise 15.13.
We have just conducted a study comparing cognitive development of low-birthweight(premature) and normal-birthweight babies at one year of age. Using a score of my own devising, I found the sample means of the two groups to be 25 and 30, respectively, with a pooled standard deviation (s) of 8. There
A neuroscience laboratory run by a friend of mine studied avoidance behavior in rabbits for many years and published numerous papers on the topic. It is clear from this research that the mean response latency for a particular task is 5.8 seconds with a standard deviation of 2 seconds (based on a
How many subjects would we need in Exercise 15.6 to have
Diagram the situation described in Exercise 15.6 along the lines of Figure 15.1.
Diagram the situation described in Exercise 15.3 along the lines of Figure 15.1.
I am very confident that I am a better technical skier than my brother, but I don’t expect that if a judge watched us descend through the trees, I would always get a better rating.What does that statement have to do with statistical power?
With respect to the previous exercise, what would happen if regardless of
Given the definition of a weighted average (see page 359), show what the pooled variance estimate would be if the two sample sizes were equal. (Hint: Replace and with )
What do the answers to Exercises 14.15 and 14.16 tell you about the predictive utility of the ADDSC score?
Calculate Cohen’s for the data in Exercise 14.15.
Calculate the 95% confidence limits on for the data in Exercise 14.8.
Calculate the 95% confidence limits on for the data in Exercise 14.1.
Much has been made of the concept of experimenter bias, which refers to the fact that for even the most conscientious experimenters there seems to be a tendency for the data to come out in the desired direction. Suppose we use students as experimenters. All the experimenters are told that
The Thematic Apperception Test presents participants with ambiguous pictures and asks them to tell a story about them. These stories can be scored in any number of ways. Werner, Stabenau, and Pollin (1970) asked mothers of 20 Normal and 20 Schizophrenic children to complete the TAT and then scored
Using your answer to Exercise 13.14 and your knowledge about correlation, how would you expect the degree of correlation between two variables (sets of data) to affect the magnitude of the test between them?
Assume that the mean and the standard deviation of the difference scores in Exercise 13.6 would remain the same if we added more subjects. How many subjects would we need to obtain a that is significant at (two-tailed)? (The difference was significant at but not at ) (We will return to this general
Compute a measure of effect size for the data in Exercise 13.6, and tell what this measure indicates.
Why would you use a paired test in Exercise 13.6?
Hoaglin, Mosteller, and Tukey (1983) present data on blood levels of beta-endorphin as a function of stress. They took beta-endorphin levels for 19 patients 12 hours before surgery and again 10 minutes before surgery. The data are presented below, in fmol/ml:12 Hours 10 Minutes Subject Before
For the data in Exercise 13.1, create a scatterplot and calculate the correlation between husband’s and wife’s sexual satisfaction. How does this amplify what we have learned from the analysis in Exercise 13.1?
In the study referred to in Exercise 13.1, what, if anything, does your answer to that question tell us about whether couples are sexually compatible? What do we know from this analysis, and what don’t we know?
Hout, Duncan, and Sobel (1987) reported on the relative sexual satisfaction of married couples. They asked each member of 91 married couples to rate the degree to which they agreed with “Sex is fun for me and my partner” on a four-point scale ranging from “never or occasionally” to
In Exercise 12.14 you probably solved for instead of Why was that necessary?
For the IQ data on females in Appendix D (data set Add.dat on the website), test the null hypothesis that
Compute a measure of effect size for the data in Exercise 12.11.
Compute 95% confidence limits on for the data in Exercise 12.11.
The data referred to in Exercise 12.10 (in pounds gained) follow. Run the appropriate test and draw the appropriate conclusions.ID 1 2 3 4 5 6 7 8 9 10 Gain 1.7 0.7 20.1 20.7 23.5 14.9 3.5 17.1 27.6 1.6 ID 11 12 13 14 15 16 17 18 19 20 Gain 11.7 6.1 1.1 24.0 20.9 29.1 2.1 21.4 1.4 2.3 ID 21 22 23
In Table 11.1 we saw data on the state means of students who took the SAT exam. The mean Verbal SAT for North Dakota was 515. The standard deviation was not reported.Assume that 238 students took that exam.(a) Is this result consistent with the idea that North Dakota’s students are a random
I drew 50 samples of 5 scores each from the same population that the data in Exercise 12.1 came from, and calculated the mean of each sample. The means are shown below. Plot the distribution of these means.2.8 6.2 4.4 5.0 1.0 4.6 3.8 2.6 4.0 4.8 6.6 4.6 6.2 4.6 5.6 6.4 3.4 5.4 5.2 7.2 5.4 2.6 4.4
The following numbers represent 100 random numbers drawn from a rectangular population with a mean of 4.5 and a standard deviation of 2.6. Plot the distribution of these digits.6 4 1 5 8 7 0 8 2 1 5 7 4 0 2 6 9 0 9 6 4 9 0 4 9 3 4 9 8 2 0 4 1 4 9 4 1 7 5 2 3 1 5 2 1 7 9 7 3 5 4 7 3 1 5 1 1 0 5 2 7
Compute a weighted average of the slopes of Weight predicted from Height for each gender in Exercise 11.18. Reasonable weights would be the two sample sizes. (A weighted average is simply How does that average compare to the slope for Height that you found in Exercise 11.17?
In Exercise 11.17 we ran a multiple regression with Gender as a predictor. Now run separate regressions for males and females.
The file at http://www.uvm.edu/~dhowell/fundamentals7/DataFiles/Fig9-7.dat contains Ryan’s height and weight data discussed in connection with Table 9.1. Gender is coded 1 Compare the simple regression of Weight predicted from Height with the multiple correlation of weight predicted from both
Now restrict the data set in Exercise 11.15 to 8, then 6, then 5 cases, and record the changing values of Remember that these are only random data.
Use the table of random numbers (Table E.9 in the Appendix) to generate data for 10 cases on 6 variables, and label the first variable and the following variables and Now use any regression program to predict from all five predictors using the complete data set with 10 cases. Are you surprised at
The data set Harass.dat, included on this book’s Web site, contains data on 343 cases created to replicate the results of a study of sexual harassment by Brooks and Perot (1991). The variables are, in order, Age, Marital Status Feminist Ideology, Frequency of the Behavior, Offensiveness of the
Interpret the results of the analysis in Exercise 11.10.
Calculate the adjusted R2R2 for the 15 cases in Exercise 11.6. Twice in this chapter I said that we were going to ignore the adjusted R2R2, even though it is a perfectly legitimate statistic. Can you tell what it is “adjusting” for?
On the basis of your answer to Exercise 11.4, speculate on one of the reasons why Religious Influence might be an important predictor of Optimism, while Religious Involvement is not.
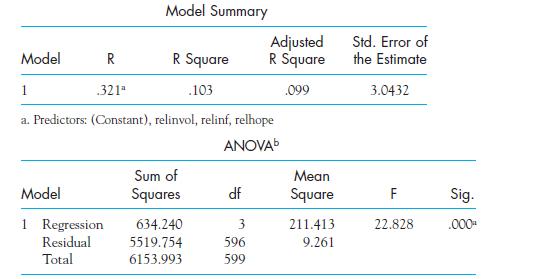
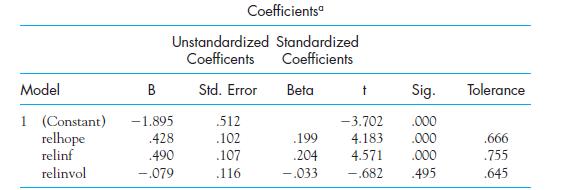
In Exercise 11.2, which variables make a significant contribution to the prediction of Optimism as judged by the test on their slopes?
Sethi and Seligman (1993) examined the relationship between optimism and religious conservatism by interviewing over 600 subjects from a variety of religious organizations. We can regress Optimism on three variables dealing with religiosity. These are the influence of religion on their daily lives
A psychologist studying perceived “quality of life” in a large number of cities 1N 5 1502 came up with the following equation using mean temperature (Temp), median income in$1,000 (Income), per capita expenditure on social services (SocSer), and population density (Popul) as predictors.Y ˆ5
Give an example in everyday life wherein context affects behavior.For Exercises
–1.6, suppose that we design a study that involves following heroin addicts around and noting the context within which they inject themselves and the kind of reaction that results.
In this hypothetical study, what would the population of interest be?
In this study, how would we define our sample?
For the heroin study, identify a parameter and a statistic in which we might be interested.
To better understand the role of “context” in the morphine study, what would you expect to happen if you put decaf in your mother’s early morning cup of coffee?
The Mars Candy Company actually keeps track of the number of red, blue, yellow, etc.M&MsTM there are in each batch. (These make wonderful examples for discussions of sampling.)(a) This is an example of ___________ data. An example of the use of M&MsTM to illustrate statistical concepts can be found
Connect to http://www.uvm.edu/~dhowell/fundamentals7/Websites/Archives.html What kinds of material can you find there that you want to remember to come back to later as you work through the book?
Connect to any search engine on the Internet, such as Google http://www.google.com and search for the word “statistics.”(a) How would you characterize the different types of sites that you find there?(b) You should find at least one electronic textbook in addition to Wikipedia (an online, user
An interesting Web source contains a collection of Web pages known as “Surf Stat” maintained by Keith Dear at the University of Newcastle in Australia. The address is http://surfstat.anu.edu.au/surfstat-home/surfstat-main.html Go to these pages and note the kinds of pages that are likely to be
If you have access to SPSS, go to the Web site for this book.http://www.uvm.edu/~dhowell/fundamentals7/Select the link for the short SPSS manual and read the introduction. Download the“apgar.sav” file referenced there and open it in SPSS. To download the file, right click on the file name and
In Section
I talked about the chain of assumptions that take us from a human heroin addict under a bridge to a mouse on a warm surface. List those assumptions.
Write a sentence describing the morphine tolerance experiment in terms of an independent variable and a dependent variable.Exercises 2.7–2.10 relate to a study conducted by Pliner and Chaiken (1990). In their study about the social desirability of behavior, they examined the amount of food eaten
What are the independent variables in the study just described?
What is the dependent variable in that study?
First write down six sequences of heads and tails that you might expect to occur on five coin flips (e.g., HTHHT). Then take an actual coin and create another six sequences by flipping the coin five times for each sequence. Next go to the following link at Chance News and read the article on
In a study of the moon illusion that we will discuss in Chapter 5, Kaufman and Rock (1962)tested an earlier hypothesis about reasons for the moon illusion by comparing how observers performed when they were able to look at the moon with their eyes level and again with their eyes elevated. The data
1.00
1.25
1.02
1.86
1.73 Using to represent this variable,(a) What are , , and ?(b) Calculate .(c) Write the summation notation for (b) in its most complex form.
With reference to Exercise 2.15, the data for the Eyes Elevated condition are
1.06
1.40
1.13
1.73
1.56 Using for this variable,(a) What are and ?(b) Calculate ©Y.
Using the data from Exercise 2.15,(a) Calculate ( )2 and 2.(b) Calculate /N, where N the number of scores.(c) What do you call what you just calculated?
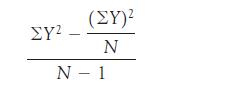
Using the data from Exercise 2.16,(a) Calculate ( )2 and 2.(b) Given the answers to (a), calculate(c) Calculate the square root of the answer to (b). (You will come across these calculations again in Chapter 5.) () 2 - 1 N
The data from Exercises 2.15 and 2.16 come from the same 10 (N) observers. In other words, the same person had a score of 1.65 in the Eyes Level condition and
in the Eyes Elevated condition. Therefore the data form pairs of scores.(a) Multiply the scores in each pair together to get a variable called XY.(b) Calculate .(c) Calculate .(d) Do and differ, and would you normally expect them to?(e) Calculate(You will come across these calculations again in
Use the previous data to show that(a) ©1X 1 Y2 5 ©X 1 ©Y(b) ©XY ? ©X©Y(c) ©CX 5 C©X(d) ©X2 ? 1©X22
Make up five data points and show that (X C) X NC, where C is any constant(e.g., 4) and N is the number of data points.
The Chicago Tribune of July 21, 1995 reported on a study by a fourth-grade student named Beth Peres. In the process of collecting evidence in support of her campaign for a higher allowance, she polled her classmates on what they received as an allowance. She was surprised to discover that the 11
There has recently been discussion on the Internet concerning whether the Shuffle feature on your iPod is truly random. (Now that is really an important issue of great concern!) How would you go about deciding whether the playing sequence is random? What would actually constitute randomness? An
Go to the Internet link at http://www.stat.ucla.edu/cases/yale/and read the very short case study there. Answer the questions on sampling and compare your answers to the explanation given in an accompanying link labeled “Explain” in the lower left corner of the page.
Have you ever wondered how you would do on the SATs if you didn’t even bother to read the passage you were asked about?6 Katz, Lautenschlager, Blackburn, and Harris(1990) asked students to answer SAT-type questions without seeing the passage on which the questions were based. This was called the
Make a histogram for the data in Exercise 3.1 using a reasonable number of intervals.
What kind of stems would you need for a stem-and-leaf display of the data in Exercise 3.1?
As part of the study described in Exercise 3.1, the experimenters obtained the same kind of data from a smaller group who had read the passage before answering the questions (called the Passage group). Their data follow.66 75 72 71 55 56 72 93 73 72 72 73 91 66 71 56 59(a) What can you tell just by
In Chapter 2, Exercise 2.4, I asked those with access to SPSS to go to the book’s Web site, find the short SPSS manual, and download the apgar.sav file. If you did not do that exercise, go back and read the question to see how to download the file and then open it in SPSS. The introduction to
Using SPSS with the data imported in Exercise 3.7, determine the percentage of times when the observer (myself ) gave the wrong response by looking at the Accuracy variable.Plot and describe the distribution of reaction time data.The next two exercises refer to a large data set in Appendix D. The
Create a histogram for the data for GPA in Appendix D, using reasonable intervals.
Showing 5100 - 5200
of 6202
First
45
46
47
48
49
50
51
52
53
54
55
56
57
58
59
Last
Step by Step Answers