

Draw a time series plot of the percentage of the Ontario population aged 65 years and older
Question:
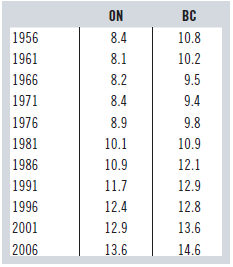
Draw a time series plot of the percentage of the Ontario population aged 65 years and older from 1956 to 2006. Describe the trends that emerge.
The table below gives the percentage of the Ontario and British Columbia population aged 65 years and older according to the Canadian Census from 1956 to 2006:
Fantastic news! We've Found the answer you've been seeking!
Step by Step Answer:
The percentage over 65 in Ontario was roughl...View the full answer

Answered By
SUMAN DINDA
I LIKE TO TEACH STUDENTS. SO, I START MYSELF AS A PRIVATE TUTOR. I TEACH STUDENTS OF DIFFERENT CLASSES. I HAVE ALSO DONE BACHELOR OF EDUCATION DEGREE(B.ED). DURING THIS COURSE I HAD TO TEACH IN A SCHOOL. SO I HAVE A GOOD EXPERIENCE IN TEACHING.
1+ Reviews
10+ Question Solved
Related Book For 

Business Statistics
ISBN: 9780133899122
3rd Canadian Edition
Authors: Norean D. Sharpe, Richard D. De Veaux, Paul F. Velleman, David Wright
Question Posted:
