

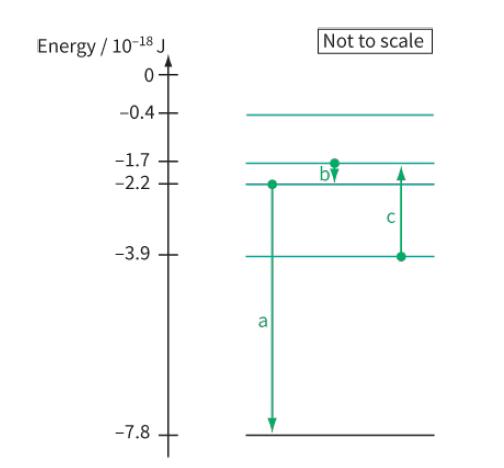
Figure 28.19 shows part of the energy level diagram for the electrons in an imaginary atom. The
Question:
Figure 28.19 shows part of the energy level diagram for the electrons in an imaginary atom. The arrows represent three transitions between the energy levels. For each of these transitions:
a. Calculate the energy of the photon
b. Calculate the frequency and wavelength of the electromagnetic radiation (emitted or absorbed)
c. State whether the transition contributes to an emission line in the spectrum or an absorption line in the spectrum.
Fantastic news! We've Found the answer you've been seeking!
Step by Step Answer:
a To calculate the energy of the photon we need to know the energy difference between the two energy ...View the full answer

Answered By
Akshay Shete
I have extensive experience as a tutor, both online and in-person. I have worked with students of all ages and abilities, and am skilled at adapting my teaching style to meet the needs of each individual student. I have a strong background in a variety of subjects, including math, science, and English, and am able to break down complex concepts in a way that is easy for students to understand. In addition to my subject matter expertise, I am also a patient and supportive teacher, and am committed to helping my students succeed. Whether I am working with a struggling student who needs extra help to catch up, or an advanced student looking to get ahead, I am able to provide the guidance and support they need to reach their goals. Overall, my hands-on experience as a tutor has prepared me to be a confident and effective teacher, and I am excited to use my skills to help students succeed.
0 Reviews
10+ Question Solved
Related Book For 
Cambridge International AS And A Level Physics Coursebook
ISBN: 9781108859035
3rd Edition
Authors: David Sang, Graham Jones, Gurinder Chadha, Richard Woodside
Question Posted:
