

The data in the following table give the solubility of silver chloride in various aqueous solutions at
Question:
The data in the following table give the solubility of silver chloride in various aqueous solutions at 25°C. Show that these data can be plotted on the same ln Ks versus √I curve as used in Illustration 13.2-3.
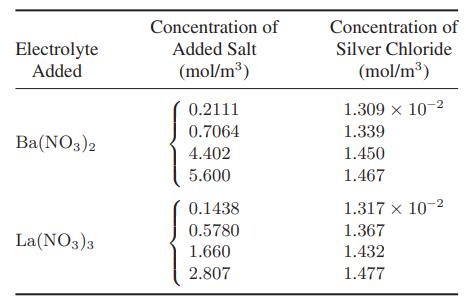
Illustration 13.2-3.
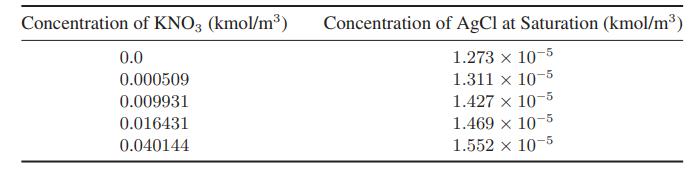
Calculation of the Solubility Product from Solubility Data The following data give the solubility of silver chloride in aqueous solutions of potassium nitrate at 25°C:
Fantastic news! We've Found the answer you've been seeking!
Step by Step Answer:
We must first comprehend the link between solubility product Ks ionic strength I and the solubility ...View the full answer

Answered By
Benard Ndini Mwendwa
I am a graduate from Kenya. I managed to score one of the highest levels in my BS. I have experience in academic writing since I have been working as a freelancer in most of my time. I am willing to help other students attain better grades in their academic portfolio. Thank you.
107+ Reviews
240+ Question Solved
Related Book For 

Chemical Biochemical And Engineering Thermodynamics
ISBN: 9780470504796
5th Edition
Authors: Stanley I. Sandler
Question Posted:
