

Question: Plot equilibrium data from Table 13-A1 for tri-ethylamine (solvent), carbon tetrachloride (solute), acetic acid (diluent) on a right triangle diagram with ordinate (=) mole fraction
Plot equilibrium data from Table 13-A1 for tri-ethylamine (solvent), carbon tetrachloride (solute), acetic acid (diluent) on a right triangle diagram with ordinate \(=\) mole fraction \(\mathrm{CCl}_{4}\) and abscissa \(=\) mole fraction acetic acid. Solve following two stage crossflow problem graphically. \(\mathrm{F}=10 \mathrm{kmol} / \mathrm{h}\), and feed is \(10 \mathrm{~mol}_{2} \mathrm{CCl}_{4}\) and \(90 \mathrm{~mol} \%\) acetic acid. Entering solvent is pure and \(10 \mathrm{kmol} / \mathrm{h}\) are added to each stage. Find mole fractions and flow rates of extract streams and raffinate stream.
Table 13-A1
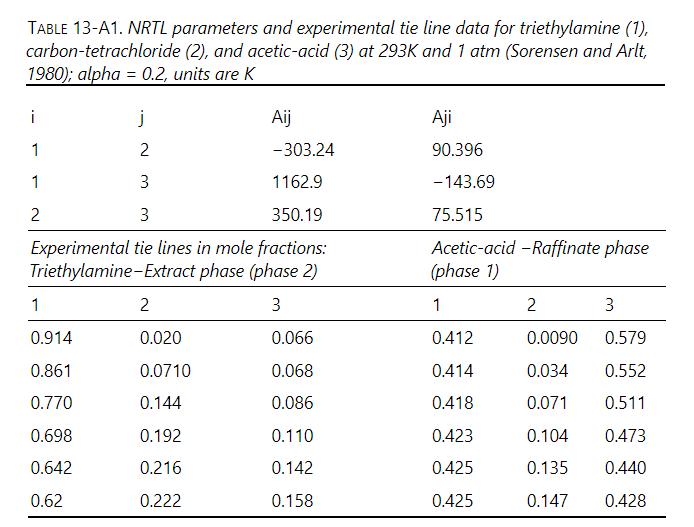
TABLE 13-A1. NRTL parameters and experimental tie line data for triethylamine (1), carbon-tetrachloride (2), and acetic-acid (3) at 293K and 1 atm (Sorensen and Arlt, 1980); alpha=0.2, units are K i j 1 2 1 3 2 3 Aij Aji -303.24 90.396 1162.9 -143.69 350.19 75.515 Experimental tie lines in mole fractions: Triethylamine-Extract phase (phase 2) Acetic-acid -Raffinate phase (phase 1) 1 2 3 1 2 3 0.914 0.020 0.066 0.412 0.0090 0.579 0.861 0.0710 0.068 0.414 0.034 0.552 0.770 0.144 0.086 0.418 0.071 0.511 0.698 0.192 0.110 0.423 0.104 0.473 0.642 0.216 0.142 0.425 0.135 0.440 0.62 0.222 0.158 0.425 0.147 0.428
Step by Step Solution
There are 3 Steps involved in it

Get step-by-step solutions from verified subject matter experts