

An inductor (L = 80 mH) is subjected to a time- varying current according to the graph
Question:
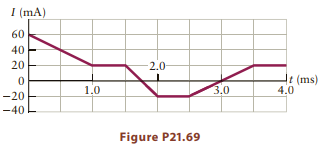
An inductor (L = 80 mH) is subjected to a time- varying current according to the graph in Figure P21.69. Plot the corresponding emf as a function of time. What is the highest potential difference produced? What is the lowest? Assume the potential of the supply voltage is positive so that a decrease in current generates a positive voltage drop across the inductor.
Fantastic news! We've Found the answer you've been seeking!
Step by Step Answer:
The emf across an inductor depends on the inductance and th...View the full answer

Answered By
Shristi Singh
A freshman year metallurgy and material science student in India.
2+ Reviews
10+ Question Solved
Related Book For 
College Physics Reasoning and Relationships
ISBN: 978-0840058195
2nd edition
Authors: Nicholas Giordano
Question Posted:
