

Question: Draw a possible positiontime graph for an object whose velocity as a function of time is described by (a) Figure P2.28 and (b) Figure P2.29.
(a) Figure P2.28 and
(b) Figure P2.29.
Figure P2.28
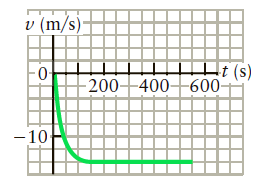
Figure P2.29
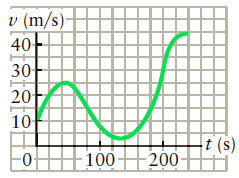
v (m/s) HHt (s) 200-40060- 0- -10 v (m/s) 40- 30- 20 10 100 t (s) 200- 0-
Step by Step Solution
★★★★★
3.44 Rating (173 Votes )
There are 3 Steps involved in it
1 Expert Approved Answer
Step: 1 Unlock

Apply graphical analysis of motion See Figures P22829 and Ans230ab for one possible answer Use the g... View full answer
Question Has Been Solved by an Expert!
Get step-by-step solutions from verified subject matter experts
Step: 2 Unlock
Step: 3 Unlock