

Question: The Bode (mathrm{dB}) plot is shown below. The corresponding transfer function model is (a) (frac{10^{4}(1+j omega)}{(10+j omega)(100+j omega)^{2}}) (b) (frac{10^{-1}(1+j omega)}{(10+j omega)(100+j omega)^{2}}) (c) (frac{10^{-4}(1+j
The Bode \(\mathrm{dB}\) plot is shown below. The corresponding transfer function model is
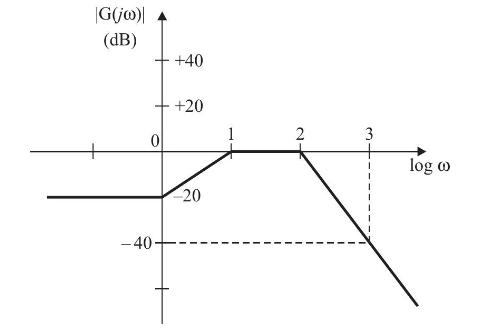
(a) \(\frac{10^{4}(1+j \omega)}{(10+j \omega)(100+j \omega)^{2}}\)
(b) \(\frac{10^{-1}(1+j \omega)}{(10+j \omega)(100+j \omega)^{2}}\)
(c) \(\frac{10^{-4}(1+j \omega)}{j \omega(j \omega+100)^{2}}\)
(d) \(\frac{10^{4}(1+j \omega)}{\left(1+j \frac{\omega}{10}ight)\left(1+j \frac{\omega}{100}ight)^{2}}\)
G(jw)| (dB) 0 -40- +40 +20 20 1 2 -N 3 log o
Step by Step Solution
3.38 Rating (157 Votes )
There are 3 Steps involved in it
The Bode plot shown in the image provides information about the frequency response of a system To determine the corresponding transfer function model ... View full answer

Get step-by-step solutions from verified subject matter experts