

Figure P3.16 shows a schematic description of the global carbon cycle (Li, ). In the figure, m
Question:
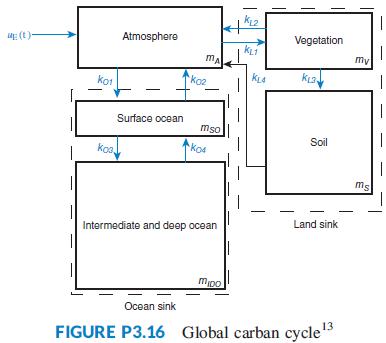
Figure P3.16 shows a schematic description of the global carbon cycle (Li, ). In the figure, mA(t) represents the amount of carbon in gigatons (GtC) present in the atmosphere of earth; mV(t) the amount in vegetation; ms(t) the amount in soil; mSO(t) the amount in surface ocean; and mIDO(t) the amount in intermediate and deep ocean reservoirs. Let uE(t) stand for the human generated CO2 emissions (GtC/yr). Fromthe figure, the atmospheric mass balance in the atmosphere can be expressed as:
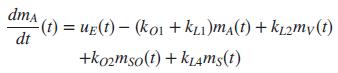
where the k’s are exchange coefficients (yr-1).
a. Write the remaining reservoir mass balances. Namely, write equations for dmSO(t)/dt ; dmIDO(t)/dt ; dmV (t)/dt ; and dmS(t)/dt
b. Express the system in state-space form.
Fantastic news! We've Found the answer you've been seeking!
Step by Step Answer:

Answered By
Hassan Imtiaz
The following are details of my Professional Experience. Responsibilities Eight years of demanding teaching experience in the field of finance and business studies at Master’s Level. Completion of the given tasks within given time with quality and efficiency. Marketing professional with practical experience in and solid understanding of a diverse range of management applications, including market analysis, sales and marketing, team building and quality assurance. I have excellent skills to approach deal and sustain corporate clients / customers by demonstrating not only extraordinary communication and interpersonal skills but also high caliber presentation, negotiation and closing skills. Manage and follow up the day-to-day activities. Manage and co-ordinate the inventories. Fulfillment of all the tasks assigned.
The following are details of my Areas of Effectiveness. Finance 1. Corporate Finance 2. Advanced Corporate Finance 3. Management of Financial Institutions 4. International Financial Management 5. Investments 6. Fixed Income 7. Real Estate Investment 8. Entrepreneurial Finance 9. Derivatives 10. Alternative Investments 11. Portfolio Management 12. Financial Statement Analysis And Reporting (US GAAP & IFRS) 13. International Financial Markets 14. Public Finance 15. Personal finance 16. Real estate 17. Financial Planning Quantitative Analysis 1. Time Value Of Money 2. Statistics 3. Probability Distribution 4. Business Statistics 5. Statistical Theory and Methods Economics 1. Principles of Economics 2. Economic Theory 3. Microeconomic Principles 4. Macroeconomic Principles 5. International Monetary Economics 6. Money and Banking 7. Financial Economics 8. Population Economics 9. Behavioral Economics International Business 1. Ethics 2. Business Ethics 3. An introduction to business studies 4. Organization & Management 5. Legal Environment of Business 6. Information Systems in Organizations 7. Operations Management 8. Global Business Policies 9. Industrial Organization 10. Business Strategy 11. Information Management and Technology 12. Company Structure and Organizational Management Accounting & Auditing 1. Financial Accounting 2. Managerial Accounting 3. Accounting for strategy implementation 4. Financial accounting 5. Introduction to bookkeeping and accounting Marketing 1. Marketing Management 2. Professional Development Strategies 3. Business Communications 4. Business planning 5. Commerce & Technology Human resource management 1. General Management 2. Conflict management 3. Leadership 4. Organizational Leadership 5. Supply Chain Management 6. Law 7. Corporate Strategy Creative Writing 1. Analytical Reading & Writing Other Expertise 1. Risk Management 2. Entrepreneurship 3. Management science 4. Organizational behavior 5. Project management 6. Financial Analysis, Research & Companies Valuation 7. And any kind of Excel Queries
150+ Reviews
230+ Question Solved
Related Book For 
Question Posted:
