

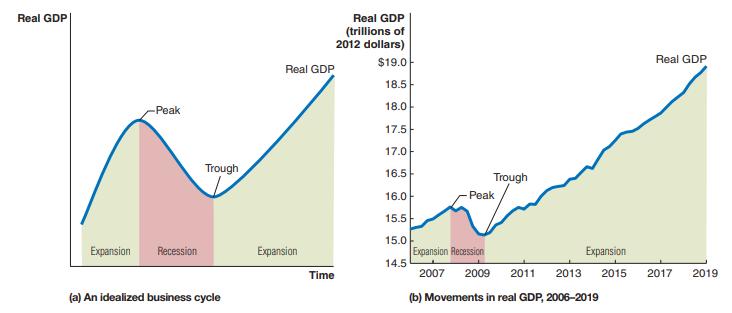
Figure 20.6 shows the business cycle of a country during and after the 2008 economic crisis. Use
Question:
Figure 20.6 shows the business cycle of a country during and after the 2008 economic crisis. Use the data in the following graph to discuss how movements in potential GDP can be explained by the analysis in this chapter.
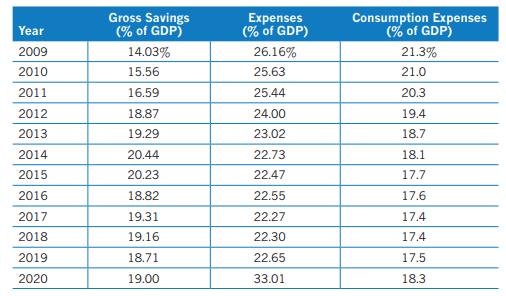
Figure 20.6
Step by Step Answer:

This question has not been answered yet.
You can Ask your question!
Related Book For 

Question Posted:
