The price index figures for country X for two years are shown below: Base year= 2019 1.
Question:
The price index figures for country X for two years are shown below:
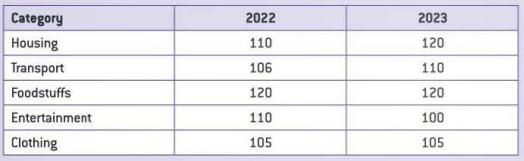
Base year= 2019
1. Calculate the average index for each year.
2. Calculate the unweighted inflation rate for 2022/23. The expenditure patterns of the population of the country are surveyed and it is discovered that the average household spends 35% of its income on housing. 25% on transport, 15% on foodstuffs, 15% on entertainment and 10% on clothing.
3. Explain, with the help of the figures above, the relative importance of the weighting.
4. Assuming that consumer expenditure patterns do not change over the period 2022/23, construct a table showing the weighted indices for 2022 and 2023.
5. Calculate the weighted inflation rate for 2022/23.
6. Explain the differences between the inflation rates that you have calculated in 2 and 5.
Step by Step Answer: