

As a financial analyst, you want to convince a client of the merits of investing in firms
Question:
As a financial analyst, you want to convince a client of the merits of investing in firms that have just entered a stock exchange, as an initial public offering (IPO). Thus, you gather data on 116 firms that priced during the six-month time frame of January 1 through June 1, 1998. By looking at this recent historical data, you are able to compute RETURN, the firm's one-year return (as a percentage). You are also interested in looking at financial characteristics of the firm that may help you understand (and predict) the return. You initially examine REVENUE, the firm's 1997 revenues in millions of dollars. Unfortunately,
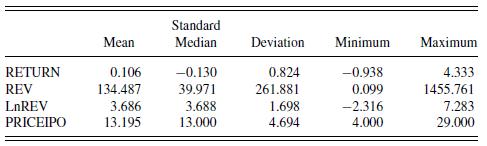
this variable was not available for six firms. Thus, the statistics here are for the 110 firms that have both REVENUES and RETURNS. In addition, Table 2.10 provides information on the (natural) logarithmic revenues, denoted as LnREV, and the initial price of the stock, denoted as PRICEIPO.
a. You hypothesize that larger firms, as measured by revenues, are more stable and thus should enjoy greater returns. You have determined that the correlation between RETURN and REVENUE is -0.0175 .
a(i). Calculate the least squares fit using REVENUE to predict RETURN. Determine \(b_{0}\) and \(b_{1}\).
a(ii). For Hyperion Telecommunications, REVENUE is 95.55 (millions of dollars). Calculate the fitted RETURN using the regression fit in part a(i).
b. Table 2.11 summarizes a regression using logarithmic revenues and returns.
b(i). Suppose instead that you use LnREVs to predict RETURN. Calculate the fitted RETURN under this regression model. Is this equal your answer in part a(ii)?
b(ii). Do logarithmic revenues significantly affect returns? To this end, provide a formal test of hypothesis. State your null and alternative hypotheses, decision-making criterion, and your decisionmaking rule. Use a \(10 \%\) level of significance.
b(iii). You conjecture that, other things equal, that firms with greater revenues will be more stable and thus enjoy a larger initial return. Thus, you wish to consider the null hypothesis of no relation between LnREV and RETURN versus the alternative hypothesis that there is a positive relation between LnREV and RETURN.
To this end, provide a formal test of hypothesis. State your null and alternative hypotheses, decision-making criterion, and decision-making rule. Use a \(10 \%\) level of significance.
c. Determine the correlation between LnREV and RETURN. Be sure to state whether the correlation is positive, negative, or zero.
d. You are considering investing in a firm that has \(\mathrm{LnREV}=2\) (so revenues are \(e^{2}=7.389\) millions of dollars).
d(i). Using the fitted regression model, determine the least squares point prediction.
d(ii). Determine the \(95 \%\) prediction interval corresponding to your prediction in part(i).
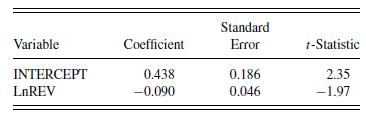
Notes: \(s=0.8136\), and \(R^{2}=0.03452\).
e. The \(R^{2}\) from the fitted regression model is a disappointing 3.5\%. Part of the difficulty is due to observation number 59, the Inktomi Corporation. Inktomi sales are 12th smallest of the data set, with LnREV \(=1.76\) (so revenues are \(e^{1.76}=5.79\) millions of dollars), yet it has the highest first-year return, with RETURN \(=433.33\).
e(i). Calculate the residual for this observation.
e(ii). What proportion of the unexplained variability (error sum of squares) does this observation account for?
e(iii). Define the idea of a high leverage observation.
e(iv). Would this observation be considered a high leverage observation? Justify your answer.
Step by Step Answer:


Regression Modeling With Actuarial And Financial Applications
ISBN: 9780521135962
1st Edition
Authors: Edward W. Frees
